Measuring Security’s Business Impact: KPIs That Matter to Executives
In executive leadership meetings, finance talks ROI, marketing tracks market share, and operations reviews efficiency. So where does security fit in? Far too often, CISOs present a stream of technical metrics: number of patches, vulnerabilities remediated, incidents contained. But executives don’t digest data that speaks only to IT, they want to fund initiatives that protect revenue, reduce risk, and fuel innovation.


Bridging the Security–Business Divide
In executive leadership meetings, finance talks ROI, marketing tracks market share, and operations reviews efficiency—so where does security fit in? Far too often, CISOs present a stream of technical metrics: number of patches, vulnerabilities remediated, incidents contained. But executives don’t digest data that speaks only to IT—they want to fund initiatives that protect revenue, reduce risk, and fuel innovation.
A security dashboard that reflects the business reality changes that conversation. When security metrics tie directly to operational agility, brand health, and financial outcomes, CISOs move from IT gatekeepers to strategic partners. In this post, you’ll discover three KPI categories that resonate with boards and executives—plus a sample dashboard layout you can adapt.
1. Revenue Protection Metrics
1.1 MTTI / MTTR Impact on Uptime
Downtime is revenue lost. Track Mean Time to Identify (MTTI) and Mean Time to Respond (MTTR), and convert them into estimated hours or days of prevented downtime during incidents. This can then be translated into $ saved—especially critical for digital-native or service-oriented businesses.
1.2 Incidents Avoided (by Severity Tier)
Rather than just logging incidents, quantify the avoided breaches—especially those that could have reached “Severity 3” or higher. Estimate potential business impact: would it have disrupted sales, compliance, or customer trust?
1.3 Cost per Incident vs. Project Cost
Benchmark incident remediation cost against the cost of proactive investments (e.g. advanced detection tools, training). A trend showing that proactive spending cost‑effectively drives down incident expenses builds a strong business case.
1.4 Compliance & Fines Averted
For regulated industries, compute the financial benefit of avoided fines or penalties by showing your compliance score improvement over time. For example, achieving SOC 2 compliance last quarter avoided potential non-compliance fines of $X.
2. Risk Reduction & Resilience Metrics
2.1 Residual Risk Index (RRI)
Risk is often abstract. Create an index that normalizes residual risk across your control environment—from asset management to third-party risk—scored against an appetite scale (e.g., 1–5). Present trend lines that show risk decreasing in alignment with strategy.
2.2 Vulnerability Remediation Rate Aligned with Business Priority
Rather than total # of vulnerabilities, reframe it to show how many ‘high-impact’ vulnerabilities were remediated within SLA. Tie remediation delays to potential financial exposure.
2.3 Third-party Risk Exposure
Track percentage of critical vendors with completed assessments, SLA compliance, and residual risk ratings. Tie high-risk vendors to downstream business functions (e.g., supply chains, customer data) and quantify potential revenue or brand impact in case of compromise.
2.4 Disaster Recovery / Cyber Exercise Readiness
Alice-twist on “tabletop”: run quarterly cyber-resilience simulations. Metric could be “% of recovery objectives (RTO/RPO) met vs. targeted”—with notes on performance improvements and readiness gaps.
3. Innovation Enablement Metrics
3.1 Time-to-Secure for New Initiatives
Track how long it takes to onboard new applications, cloud roll-outs, or integrations in a secure way—especially versus delays in previous launches. Illustrate how security pushed new initiatives live faster and safer.
3.2 Secure DevOps Adoption Rate
Less a security stat, more a business enabler. Percent of code reviewed and deployed via CI/CD pipelines with embedded security controls. Align with developer productivity or release frequency improvements.
3.3 Security as a Business Enablement Quote
Capture qualitative feedback—“Security ideated early on, and we launched measurably faster”—from product labs or business units. When tied to actual dates or speed improvements, these quotes become powerful ROI statements.
3.4 ROI of Red Teaming and Penetration Testing
One-off tests are nice—but if a red team exercise reduces time to detection, or reveals high‑impact flaws that would have cost $X, detail both cost-to-conduct and cost-to-address to calculate tangible ROI.
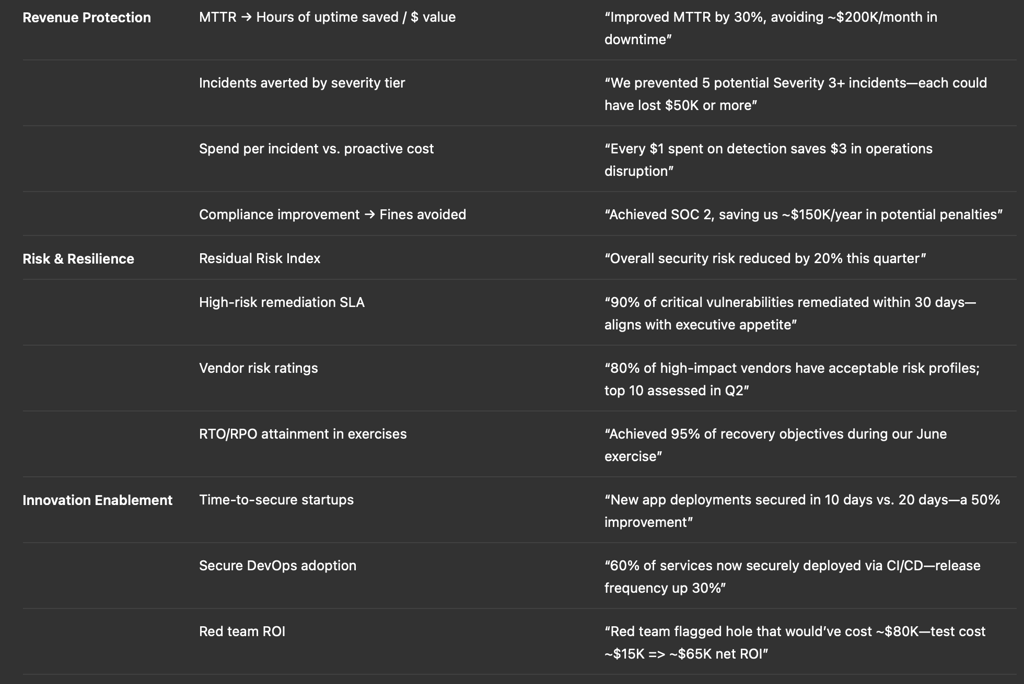
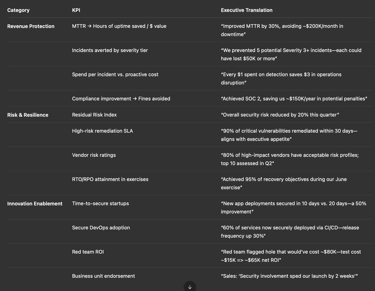
Putting It All Together: Executive Dashboard
Here’s a sample dashboard structure, visualized across three lenses: Protection, Risk, and Enablement.
Tips for Effective Presentation
1. Keep It Simple & Strategic
Present 6–9 metrics—no more. Show what’s most relevant to the C‑suite or board and allow deeper dive‑downs in dedicated appendices.
2. Use Visual Trendlines
Don’t just show static numbers. Use quarter-over-quarter bullet‑charts or trendlines—executives want directionality and momentum.
3. Tie Numbers to Dollars
Where possible, convert metrics to dollar outcomes—revenue preserved, cost avoided, launch velocity increased. Finance understands growth in currency.
4. Craft the Narrative
Begin dashboards with a short summary (“This quarter, we improved resilience, accelerated two product launches, and averted ~$500K in potential losses.”). Context drives impact.
5. Update Regularly, but With Purpose
Quarterly reporting is optimal—it matches financial rhythm. Monthly touchpoints can track execution KPIs, but board-level decks should highlight strategic movements.
6. Align with Organizational Strategy
Security must support your firm’s top imperatives—whether hitting market launch dates, preserving client trust, or entering new markets. Align each KPI to a strategic objective.
Real‑World CISO Use Case: SaaS Firm
A mid‑sized SaaS provider used this model last quarter to win budget approval:
Before: Presented 150 vulnerability tickets, 2 critical incidents, and generic loremipsum.
After: Presented:
MTTR improved by 35% = 40 hours of uptime gained = ~$120K saved.
Completed CI/CD pipeline integration, cutting secure deployment time by half—and enabling launch of new module on schedule.
Remediated 95% of high-impact vulnerabilities within SLA—kept their SOC 2 Type II report clean.
Third-party risk ratings: 90% of Tier-1 vendors assessed, reducing supply‑chain risk.
Result: Board-approved budget increase of 15%, with acceptance that security was now recognized as a growth enabler.
Call to Action
If your dashboard still features only technical metrics disconnected from business impact, it’s time for a refresh. Translate your results into executive value:
Choose 6–9 KPIs that align with strategic themes.
Quantify them in dollars, time, uptime, and risk reduction.
Visualize trends that show downward risk and upward enablement.
Narrate why the C‑suite should care and how these metrics support strategic goals.
Your next board meeting is an opportunity to move off defense into offense—show security as a strategic asset, and your next ask will be a growth story, not a compliance checkbox.
Tyson Martin is the executive public and pre-IPO companies in financial services, AI/data, SaaS, and cloud hire to make trust a measurable asset, one accountable answer to Is it secure? Is it resilient? Is the AI governed?
© 2026. All rights reserved.
Navigation
Free Resources
Contact
Stay ahead of your next board agenda
Sign up for Reports & Learnings From the Boardroom. Plain-English AI and cyber governance insights, biweekly. No pitch.
No spam. Unsubscribe anytime. · Or download the Director's AI Question Pack — 25 questions free