Board Level Risk Oversight and CISO Performance Metrics: The 5 That Matter, and the 5 That Mislead
Board Level Risk Oversight and CISO Performance Metrics: use 5 decision-grade metrics, skip 5 that mislead, set thresholds, trends, triggers.


If your board packet has ten charts and zero decisions, you're not alone. Cybersecurity metrics often arrive as busy dashboards that make you feel informed, but not in control. Meanwhile, the threat landscape of February 2026 keeps raising the stakes, ransomware keeps professionalizing, third-party outages hit without warning, cloud changes faster than policies, and AI use spreads through every team.
Board-level risk oversight and CISO performance metrics should do one job: help you make better tradeoffs. That means funding the right work, setting clear thresholds, and spotting risk drift before it becomes an incident. You don't need more numbers. You need decision-grade metrics.
Below is a simple framework: five metrics that help the board govern risk, five that create false comfort, and a practical way to use both in a board packet.
Key takeaways you can use in your next board meeting
You'll get more actionable insights from five outcome metrics than from twenty activity charts.
You should ask for a top-risk view that shows what moved up, down, or stayed stuck.
You'll make faster decisions when every metric includes a target, a trend, and a trigger.
You should treat recovery time like a business promise for cyber resilience, not a technical detail.
You'll avoid false confidence by replacing "big counts" with tiered, crown-jewel measures.
You can achieve business alignment for oversight and accountability by using a stable scorecard like board oversight and CISO performance metrics.
Start with what the board is really trying to oversee
Your job isn't to manage tools. Under the governance mandate, your job is to govern risk, approve priorities, and verify readiness. In other words, you're overseeing whether the organization can prevent avoidable harm and recover fast when prevention fails.
"Good" looks like this: you have a clear risk appetite, you can explain your top cyber risks in business terms, and you can see evidence the program is reducing financial exposure. That's why decision-grade metrics matter. A decision-grade metric changes a decision, allocates money, or triggers action.
For example, an MFA rollout doesn't matter because it's "best practice." It matters if it measurably reduces account takeover risk on the systems that run revenue, patient care, donor trust, or operations. A vendor breach doesn't matter because it happened "to them." It matters if your dependency means their failure becomes your downtime.
If you want a practical starting point for board questions that cut through the noise, use audit committee cyber risk questions.
The three questions your metrics must answer: are you safe enough, improving fast enough, and ready for a bad day?
Every metric you accept should pass a simple test.
First, what decision does it support? If the answer is "awareness," it's probably not board-level. Next, who owns it? Shared ownership often means no ownership. Finally, what happens if it moves? A metric without a defined action is just a thermometer with no treatment plan.
Ask for three elements in the board view: thresholds (what's acceptable), trends (are you getting better), and time-to-fix (how long risk stays open). That's how you turn a metric into governance.
If a metric can't trigger a decision, it's reporting, not oversight.
How to set targets without guessing: risk appetite, material systems, and time horizons
Targets feel hard when everything seems important. So don't start with "the whole environment." Start by tiering.
Name your crown jewels (the few systems and datasets tied to strategic objectives that would cause real harm if compromised). Then set tighter targets there, and looser targets elsewhere. Add time horizons so you can govern progress without waiting a year: what must improve in 30, 90, and 180 days.
You don't need perfect targets on day one. You need directionally correct targets you can tighten over time. The board's role is to approve the risk appetite tolerance, drive resource allocation, and hold management to the timeline.
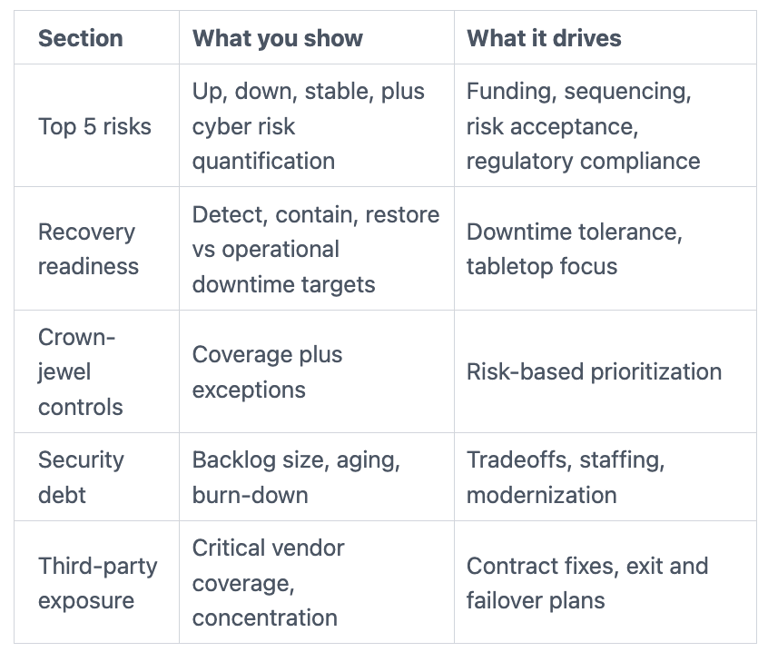
The 5 CISO performance metrics that actually help the board manage risk
You'll get the best results when you report these five key risk indicators as a small dashboard plus a short narrative. Keep definitions stable, keep time windows consistent, and explain what changed.
Material risk reduction: show the top risks, what changed, and what you need next
Definition: A ranked "top five material risk scenarios" view, with movement over time and the next decision.
Why it matters: It turns security into business tradeoffs, not tool status. You see whether risk is shrinking where it counts.
Good trend: Fewer high risks, shorter time stuck at "high," and clear mitigation milestones.
Pitfall: Listing dozens of "risks" that are really control gaps. Ask for a format that makes metrics usable for decisions, like this view on the hidden value of cyber metrics.
A simple risk card should include: risk statement, likelihood, impact, key controls, residual risk, next action, and the decision you need from the board.
Time to contain and recover: because resilience beats perfect prevention
Definition: Time to detect, time to contain, and time to restore critical services (in plain language, "how long you're down").
Why it matters: The board carries the business impact of downtime and public response, not the attack technique.
Good trend: Faster containment, faster restores, and higher confidence in restore results because you test them.
Pitfall: Reporting only "we had no incidents." Near-misses and third-party events count too. For incident response governance guidance on what boards should see, use board incident response oversight.
Critical control coverage on your highest-value systems, not across "everything"
Definition: Coverage (with quality) of a small set of high-impact security controls on crown jewels, plus exceptions.
Choose a handful you can defend, such as MFA for privileged access, backup immutability for critical data, EDR coverage on key servers, and patch SLAs for critical vulnerabilities on internet-facing assets.
Why it matters: It forces focus where impact is highest.
Good trend: Higher coverage on crown jewels, fewer exceptions, and fewer "unknown" assets.
Pitfall: Claiming coverage without confirming configuration, monitoring, and testing. "Installed" isn't the same as "working."
Security debt burn-down: how fast you are closing the gaps that matter
Definition: The size, age, and burn-down rate of known, prioritized gaps that increase risk.
Security debt includes unsupported systems, weak identity design, fragile backups, and missing logging on critical systems. Track what's added, what's closed, and what's aging past target.
Why it matters: Debt predicts future incidents. It also shows whether funding matches reality.
Good trend: High-risk items close faster than new ones arrive, and old items don't linger.
Pitfall: Treating debt as "IT backlog" with no risk owner. Frame it in business terms using measuring security's business impact.
Third-party exposure on your most important vendors, measured by business dependency
Definition: Percent of critical vendors with current third-party risk reviews, contract controls, and tested incident communication paths, plus concentration risk.
Why it matters: Your biggest outage might come through a vendor you can't patch.
Good trend: Critical vendors have clear notification timelines, validated contacts, and fewer "high dependency, low visibility" relationships.
Pitfall: Relying on generic vendor scores. You need measures tied to what you can change: contracts, access scope, and failover plans.
The 5 metrics that mislead boards, and what to ask for instead
These metrics aren't always "wrong." They're just easy to game, easy to misread, and rarely tied to a board decision.
Counting policies, trainings, or controls, instead of proving they work
Why it misleads: Completion is not effectiveness. You can hit 99 percent training completion and still wire money to a fraudster.
What to ask for instead: Trends in phishing resilience for high-risk roles, access review completion for privileged accounts, and control testing pass rates based on the NIST Cybersecurity Framework.
Raw vulnerability counts, which punish visibility and ignore business impact
Why it misleads: Total vulnerabilities spike when scanning improves. Teams then chase the biggest number, not the biggest risk.
What to ask for instead: Critical vulnerability remediation time on crown jewels, and percent past due by severity and asset tier.
Blocked attacks and alert volume, the more noise you have, the safer you feel
Why it misleads: More alerts can mean weaker prevention, broader logging, or a mis-tuned tool. These volume metrics act like misleading key performance indicators, unlike true outcome metrics.
What to ask for instead: Detection coverage on key attack paths, and time-to-triage for high-confidence alerts.
Audit findings closed, without showing whether the risk is truly reduced
Why it misleads: Closure can be paperwork. A "fixed" finding might still allow the same failure mode.
What to ask for instead: Residual risk movement on the related top risk, and proof the fix prevents recurrence through testing.
Budget size as success, spending more is not the same as lowering risk
Why it misleads: Budget comparisons ignore scope, maturity, and business model. Spending can rise while risk stays flat.
What to ask for instead: Cost to reduce a specific top risk, and the measurable outcome you expect. Keep ROI on security investments thinking grounded with security ROI isn't in your tech stack.
How to turn metrics into better oversight, better decisions, and a better board packet
Metrics don't help if they show up once a quarter with no follow-through. A simple rhythm works better.
Review a small dashboard monthly to address SEC disclosure requirements (or at least at committee level). Then do one quarterly deep dive on a single theme, ransomware readiness, third-party dependency, identity risk, or recovery testing.
Here's a one-page board packet outline that stays readable:
Dashboard (the five metrics that matter, with trends and thresholds)
Top risks (what changed, what's stuck, what decision you need)
Incidents and near-misses (including third parties)
Program delivery (what you shipped that reduced risk)
Decisions needed (funding, tradeoffs, policy, risk acceptance)
A simple board dashboard layout that fits on one page and drives action
This layout keeps the board focused on decisions, not decoration.
The takeaway: fewer metrics, clearer definitions, and a consistent time window makes oversight calmer and sharper.
What the board should do when a metric goes red, the three moves that matter
When something goes red, don't demand a bigger spreadsheet. Make three moves.
First, clarify impact in business terms (money, downtime, trust, legal exposure, third-party risk). Next, approve tradeoffs (delay a launch, fund a control, ROI on security investments, accept risk with a time limit). Finally, confirm accountable owners and dates, then require a follow-up.
If you want committee-ready structure, align this with risk committee cybersecurity reporting. Also make ransomware readiness a repeating agenda item using board ransomware readiness briefing.
When red metrics don't trigger action, you train the organization to ignore red.
FAQs for directors and CEOs about Board-level Risk Oversight and CISO Performance Metrics
How many cybersecurity metrics should you ask the CISO to report to the board?
Ask for 8 to 12 total metrics, and keep five board-level outcome metrics stable. You can rotate supporting metrics quarterly, but don't rotate the core scorecard. Consistency makes trends real.
How often should you review board-level cyber metrics?
Review the core dashboard monthly at the committee level, and quarterly at the full board. Escalate immediately when a metric crosses a pre-set threshold, instead of waiting for the calendar.
How do you compare your cyber metrics to peers without chasing the wrong benchmark?
Peer comparisons using industry benchmarks and security ratings can mislead because tech stacks and risk profiles vary. Instead, benchmark your process maturity (risk tiering, recovery testing cadence, vendor governance) to create reliable internal industry benchmarks, then track your own outcome trends against your risk appetite while avoiding overreliance on external security ratings.
What is a reasonable recovery time after ransomware for a mission-driven organization?
It depends on which services must stay up, whether from ransomware or a data breach. Set recovery targets by system tier, crown jewels get the tightest targets, internal tools can be looser. Then prove the targets through restore testing, not promises.
How do you tell if the CISO is being transparent, not just optimistic?
Transparent CISOs bring bad news early, keep a stable top-risk list, demonstrate cyber risk quantification and regulatory compliance, and show measurable plans with dates. They also invite validation, such as audits, tabletop outcomes, and independent testing. For CEO guidance on evaluating leadership, use how CEOs should vet a CISO.
Conclusion
Decision-grade metrics make cyber oversight feel less like a pop quiz and more like governance. The difference is simple: the five that matter drive tradeoffs aligned with risk appetite and financial exposure, while the five that mislead create motion without clarity. Your next step is practical, refresh the one-page dashboard that delivers risk mitigation strategies, agree on thresholds tied to risk appetite and financial exposure, and schedule a tabletop that tests recovery and decision rights. All of this sharpens board communication on what truly matters. If you want help tightening oversight without adding noise, consider working with a cybersecurity board advisor.
Providing plain-English technology oversight to help Boards and CEOs lead with confidence and make defensible risk decisions.
© 2026. All rights reserved.
Navigation
Free Resources
Contact
Stay ahead of your next board agenda
Sign up for Reports & Learnings From the Boardroom. Plain-English AI and cyber governance insights, biweekly. No pitch.
No spam. Unsubscribe anytime. · Or download the Director's AI Question Pack — 25 questions free