Introduction
Boards regularly receive polished cybersecurity dashboards showing patch rates, training completions, and blocked attack counts — and still can't answer the question that actually matters: Are we safe enough?
This isn't a data problem. It's a metrics problem.
The dashboards look healthy. Controls appear green. Then an incident occurs and the story changes overnight. What was reported as "on track" turns out to have been measuring activity, not exposure. Nobody saw the risk coming because nobody was tracking the right signals.
Key Risk Indicators (KRIs) exist to close that gap. Unlike standard security metrics that describe what already happened, KRIs are forward-looking signals that tell boards whether risk is increasing before an incident forces the conversation.
This guide covers what KRIs are, how they differ from KPIs, which categories matter most at the board level, and what effective reporting actually looks like. The focus is on making KRIs useful to directors and executives, not just security operations teams.
Key Takeaways
- KRIs predict future risk exposure; KPIs measure how well security activities are executing — boards need both, but for different purposes
- Five categories matter most: attack surface, third-party risk, patch management, detection/response times, and identity/access controls
- Limit board-level reporting to 5–7 KRIs tied to your top risk scenarios
- Every KRI needs a named owner, defined thresholds, and a documented escalation path
- Trend data over time is more actionable than any single point-in-time snapshot
What Are Key Risk Indicators in Cybersecurity?
A KRI is a predictive metric that signals increasing risk exposure before an incident occurs. Think of it like a check engine light: it doesn't mean the engine has failed — it means conditions exist that could lead to failure if nothing changes.
NIST IR 8286B provides practical framing, defining both leading KRIs (such as critical patches taking 10 or more days to apply) and lagging KRIs (such as incidents caused by unmitigated vulnerabilities or missed recovery time objectives).
The NIST IR 8286 series integrates these concepts directly into enterprise risk management, giving organizations a credible foundation for building KRI programs that connect to governance.
What Separates a KRI from Any Security Metric
Not every security metric qualifies as a KRI. To make the cut, a metric must be:
- Measurable — produces a specific, repeatable number
- Forward-looking — signals future risk, not past activity
- Tied to a loss scenario — connected to a specific bad outcome your organization is trying to prevent
- Actionable when thresholds breach — someone must do something when the number moves
Most organizations track far too many metrics and far too few true KRIs. Volume counts, scan totals, and training completion rates describe what your security team did — not whether your organization is moving toward a breach.
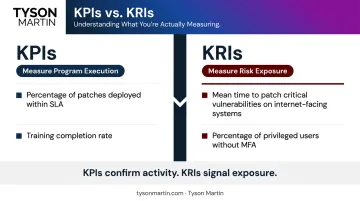
KRIs vs. KPIs: Why the Distinction Matters for Boards
KPIs and KRIs measure fundamentally different things.
KPIs measure how well security programs are executing — inputs, activities, and operational efficiency. KRIs measure exposure and the potential for loss — conditions that predict whether a bad outcome is becoming more or less likely.
Think of it this way: KPIs tell you whether the security team is doing the work. KRIs tell you whether that work is actually reducing what could go wrong.
| Metric | Type | What It Measures |
|---|---|---|
| Percentage of patches deployed within SLA | KPI | Program execution |
| Mean time to patch critical vulnerabilities on internet-facing systems | KRI | Risk exposure |
| Training completion rate | KPI | Program activity |
| Percentage of privileged users without MFA | KRI | Identity risk exposure |
The Failure Mode Boards Need to Understand
An organization can have excellent KPIs — high patch rates, full compliance certifications, 100% training completion — while still carrying unacceptable risk. If those activities aren't targeting the right exposures, they're producing the appearance of security without the substance.
This is the "all-green dashboard" problem. Everything looks on track for months. Then an incident occurs and the story changes overnight.
Boards need both KPIs and KRIs, but they need to know which is which. In practice, that means board reporting should lead with KRIs — the conditions that signal whether risk is rising or falling — not activity logs that confirm the program is busy.
The 5 Essential KRI Categories Every Organization Should Monitor
These five categories reflect real-world CISO practice and are grounded in frameworks including NIST IR 8286 and FAIR. Specific indicators within each category will vary by industry and organization size.
1. Attack Surface and Vulnerability Exposure
The primary KRI here: count of internet-facing assets with known critical vulnerabilities (CVSS score 9.0+). This matters because it combines reachability with exploitability, identifying the highest-probability attack vectors in your environment.
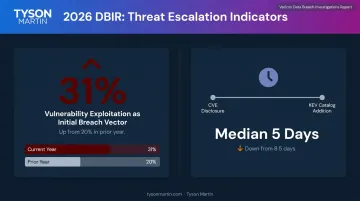
The threat data reinforces why this is board-relevant. According to the 2026 Verizon Data Breach Investigations Report, vulnerability exploitation became the most common initial breach access vector at 31%, up from 20% the prior year. Attack timelines are also compressing: Rapid7 found the median time for a vulnerability to be added to the CISA Known Exploited Vulnerabilities (KEV) catalog dropped from 8.5 days to just 5 days after disclosure.
Related indicators to monitor alongside the primary KRI:
- Shadow IT discoveries (unmanaged assets outside the known inventory)
- Exposed credentials identified on dark web monitoring
- Count of assets running end-of-life software without compensating controls
2. Third-Party and Supply Chain Risk
The key KRI: number of critical vendors with security postures below your acceptable threshold or with unresolved high-severity issues.
"Critical" means vendors with access to sensitive data or business-critical systems — not every vendor carries the same risk weight. A SaaS provider with read access to your customer database is a different exposure than an office supplies vendor.
The risk is substantial and growing. The 2026 DBIR reports that 48% of breaches now involve third parties — up 60% year over year. Traditional vendor questionnaires only provide a point-in-time view.
ISACA's guidance is direct: organizations must move from periodic assessments to ongoing monitoring that reflects real-time changes in vendor environments.
A board-ready vendor risk KRI tracks: critical vendor count, percent with open high-severity issues, remediation timeliness, and exceptions granted with expiration dates — shown as a trend over three to four reporting periods, not as a one-time score.
3. Patch Management and Configuration Health
Mean time to patch (MTTP) critical vulnerabilities is one of the most predictive KRIs available. The data on why is hard to ignore.
The 2026 DBIR found that only 26% of critical CISA KEV vulnerabilities were fully remediated in 2025, down from 38% the prior year. Median full resolution time rose to 43 days from 32 days. Given that attack timelines now compress to days after disclosure, a 43-day remediation window represents meaningful exposure.
Supplemental KRIs in this category:
- Count of end-of-life systems without documented compensating controls
- Cloud misconfiguration counts by severity
- Percentage of critical KEVs remediated within your defined SLA
4. Incident Detection and Response Times
Mean time to detect (MTTD) and mean time to contain (MTTC) predict loss magnitude, not just response efficiency. The longer an attacker operates undetected, the more damage they can cause.
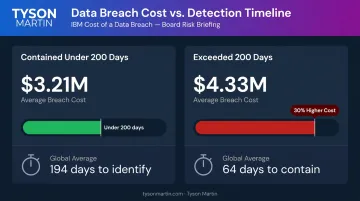
IBM's 2024 research reported global averages of 194 days to identify and 64 days to contain a breach. Earlier IBM analysis found breaches resolved in under 200 days averaged $3.21M in costs, while those exceeding 200 days averaged $4.33M — a 30% cost increase tied directly to how long attackers remain active.
These are "post-penetration" KRIs. They don't prevent entry, but they bound how much damage an attacker inflicts before being stopped.
A board tracking MTTD and MTTC trends can answer the right question: are detection investments actually reducing loss exposure, or just generating more alerts?
Supplemental KRIs to pair with MTTD and MTTC:
- Percentage of incidents detected by internal controls vs. external notification
- Mean time to escalate from detection to incident response activation
- Count of containment actions exceeding defined SLA thresholds
5. Access Control and Identity Risk
Detection time matters in part because of what attackers do while undetected. According to the 2026 DBIR, credential abuse appeared in 39% of breach progressions across the full attack chain, even as it represented only 13% of initial access vectors. Identity is how attackers move laterally once they're in.
Key KRIs in this category:
- Percentage of privileged users without MFA enrolled
- Number of accounts with excessive permissions beyond documented business need
- Time to deactivate former employee credentials after offboarding
On MFA specifically: Microsoft research found that MFA reduces account compromise risk by 99.22% overall and 98.56% for accounts with leaked credentials. For a board, that number reframes the privileged-user MFA coverage KRI: gaps in MFA enrollment aren't a configuration detail, they're a quantifiable exposure.
How to Select, Threshold, and Assign Ownership of Your KRIs
Start With Risk Scenarios, Not Available Data
The most common selection mistake is building KRIs around data that's easy to pull rather than exposures that actually matter. Start with a risk assessment that maps your organization's most critical assets to its most likely threat scenarios.
If ransomware is your primary threat, patch management and backup recovery KRIs should be prominent. If your business model creates concentrated third-party dependencies, vendor risk KRIs deserve more weight. The KRIs should trace directly to the scenarios where you'd face material loss.
Setting Thresholds That Hold
A tiered green/yellow/red approach requires two inputs: benchmarking against industry peers and alignment with the organization's stated risk appetite. Both matter. Industry benchmarks tell you what's normal; your risk appetite tells you what's acceptable for your specific business context.
Thresholds are not static. Quarterly reviews are a solid baseline, with immediate reassessments triggered by:
- Major acquisitions or divestitures
- New regulatory requirements
- Material incidents or near-misses
- Significant changes in the threat landscape
The goal is thresholds tied to specific business impacts (hours of acceptable downtime, dollars of acceptable loss, percentages of coverage required, or regulatory deadlines that can't slip) rather than vague language like "low," "moderate," or "acceptable."
Ownership Is the Most Overlooked Element
Every KRI needs a named individual owner — not a team, not a department. That person is responsible for monitoring the metric, escalating when thresholds breach, and executing remediation. Without clear ownership, KRIs become observation tools rather than action triggers.
Address Data Quality Before Trusting Outputs
Inaccurate source data produces misleading KRIs. Before relying on KRI outputs for board decisions, validate your data sources, establish a clear system of record for each metric, and mark data confidence levels honestly. Boards build more trust in reporting that acknowledges data limitations than in reporting that projects false precision.
Automate What You Can
Manual KRI tracking introduces delays that undermine predictive value. Modern programs integrate security tools, vulnerability scanners, and asset inventories via APIs to calculate KRIs automatically and trigger alerts when thresholds breach.
This is where an outside advisor helps organizations move from framework design to a 90-day implementation plan with named owners and measurable outcomes, rather than spending months on infrastructure without execution.
Reporting KRIs to the Board: Turning Data into Defensible Decisions
What Effective Board Reporting Looks Like
The board needs to see whether risk is increasing or decreasing over time — not a snapshot of today's alert count. Trend over time is the core of useful KRI reporting.
Per NACD's 2026 cyber risk oversight guidance, board reporting should translate technical data into business-relevant terms, occur at least quarterly, and escalate immediately after material incidents or significant changes in risk exposure.
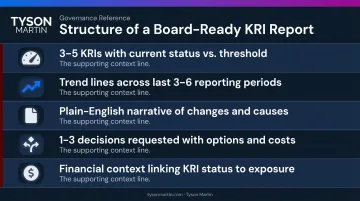
Structure of a Board-Ready KRI Report
A well-structured board KRI report includes:
- 3–5 KRIs with current status vs. defined threshold
- Trend lines covering the last 3–6 reporting periods (trend arrows: improving, stable, worsening)
- Plain-English narrative explaining what changed since the last briefing and why
- 1–3 decisions requested with options, cost ranges, and a recommended path
- Financial context where KRI status connects to potential exposure
The format should stay consistent every quarter so directors can spot drift. When the structure changes every meeting, comparisons become impossible.
Translating KRIs Into Financial Terms
Connect KRI status to potential financial exposure. A rising MTTP combined with active threat intelligence about that vulnerability class represents a quantifiable increase in expected loss. The IBM Cost of a Data Breach Report 2025 puts the global average breach cost at $4.44M — a useful reference point when boards are weighing whether to fund accelerated remediation.
The translation is straightforward: instead of reporting "identity controls are weak in the cloud admin layer," frame it as "a compromised admin account could disrupt core systems, delay customer orders, and increase legal exposure if sensitive data is accessed." That framing gives directors something they can act on.
Board vs. Management Decision Rights
Boards should use KRIs to ask informed questions and make strategic decisions — not to manage security operations. When KRI thresholds are crossed, boards should:
- Approve or challenge the risk response strategy
- Authorize major control investments
- Set or revise risk appetite
- Ask whether management's narrative matches the data trend
What boards should not do is direct day-to-day security operations or get pulled into technical implementation details. The board's role is oversight. When reporting is built correctly, that boundary stays clear.
Common KRI Mistakes That Undermine Board Confidence
Tracking Too Many Indicators
Presenting 25+ KRIs to a board produces noise, not insight. When everything is highlighted, nothing is prioritized. Directors can't see what actually matters.
Limit board-level KRIs to 5–7 high-signal metrics tied to the organization's top risk scenarios. Operational teams can track a broader internal set, but what reaches the board should be tightly filtered to the essentials.
Confusing Activity Metrics for Risk Indicators
Completed training courses, number of scans run, percentage of controls implemented — these tell you about security program activity. They don't tell you whether critical systems are exposed.
A KRI must measure conditions that predict loss, not inputs to a security program. The test: if this metric moves in the wrong direction, does it mean the organization is more likely to suffer a material incident? If not, it's a KPI at best.
Failing to Connect KRIs to Action
Knowing what to measure is only half the equation. A KRI that breaches its threshold but triggers no defined response is just a data point. Every KRI needs a documented escalation path:
- Who is notified when the threshold breaches
- What root cause analysis follows
- How remediation is tracked to closure
- Who can grant exceptions, with time limits attached
Without that structure, a board can see the warning — and still have no way to confirm anyone acted on it.
Frequently Asked Questions
What is the difference between a KRI and a KPI in cybersecurity?
KPIs measure security program performance — activities, efficiency, and execution. KRIs measure forward-looking risk exposure and predict potential losses. Boards need both, but for different purposes: KPIs optimize operations, KRIs drive strategic risk decisions.
How many KRIs should an organization track?
Five to seven KRIs at the board level, tied to the organization's top risk scenarios. Operational teams can track a broader internal set. More metrics rarely produce better decisions when it comes to executive reporting — they produce more confusion.
How often should KRI thresholds be reviewed and updated?
Quarterly is the standard cadence. Trigger immediate reassessments after major acquisitions, regulatory changes, material incidents, or significant shifts in your threat environment. Thresholds are not permanent — they should evolve as the business does.
How should cybersecurity KRIs be reported to a board of directors?
Show trend over time, not point-in-time snapshots. Include a plain-English narrative of what changed and why, financial context where possible, and management's response when thresholds are breached. Five metrics with trend lines and a clear "decisions requested" section outperforms twenty charts every time.
Which KRI provides the earliest warning of a cyber incident?
Attack surface exposure provides the earliest actionable warning: internet-facing assets with critical unpatched vulnerabilities, cross-referenced with active threat intelligence. It combines reachability, exploitability, and current adversary behavior into one leading signal.
How do KRIs connect to frameworks like NIST CSF or ISO 27001?
Frameworks define what controls to implement. KRIs measure whether those controls are actually reducing risk. They're complementary, not interchangeable. A strong NIST CSF implementation with no KRI program can still leave boards unable to answer whether the controls are working.