Introduction
Most boards receive cybersecurity updates that arrive dense with technical metrics — patch percentages, alert counts, vulnerability totals — and leave the room no clearer on whether the organization is safer or more exposed than last quarter. That's not an information problem. It's a governance design problem.
The stakes are real. SEC disclosure rules (effective September 2023) require public companies to file an 8-K within four business days of a materiality determination. CIRCIA will mandate 72-hour reporting for covered critical infrastructure entities once the final rule takes effect. NIST CSF 2.0 added a dedicated Govern function in 2024, placing cybersecurity strategy and oversight squarely on the board's agenda.
Yet only 50% of cyber decision-makers surveyed by Deloitte in 2024 were "very confident" in the board and C-suite's ability to navigate cyber issues — even as 64% of boards increased their cyber agenda time.
More agenda time doesn't fix the underlying problem. Better design does.
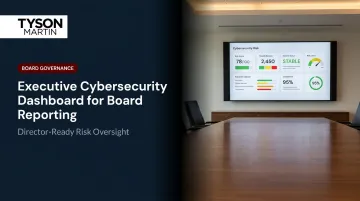
This is a practitioner's guide to building an executive cybersecurity dashboard that shows the board what changed, what it means for the business, and what decision — if any — is theirs to make. The philosophy throughout: trend over trivia, posture over noise.
Key Takeaways
- An effective board cyber dashboard is a governance instrument that surfaces decisions, not raw data
- Boards need risk trend over time, what changed since last briefing, and whether current risk sits within defined risk appetite
- The best dashboards combine 8–12 stable, business-aligned metrics with a plain-English narrative that explains business impact
- Reporting cadence and decision rights must be designed alongside the dashboard, not bolted on after the fact
Why Most Cybersecurity Dashboards Fail the Board
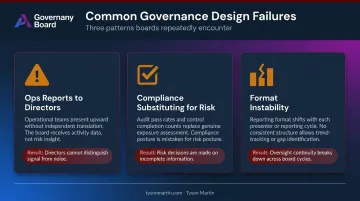
There are three failure modes that show up consistently across organizations, regardless of industry or company size.
Failure 1: Operations Reports Handed to Directors
The most common problem is dashboards built for security operations teams getting handed to board members without translation. The result is metric overload: patch percentages, vulnerability counts, SOC alert volumes — with no interpretation layer and no clear ask of the board.
Activity metrics say "we closed 97% of critical vulnerabilities." Exposure framing says "a single unpatched system can interrupt customer onboarding for 48 hours." Boards need the second, not the first. When everything looks green and no decisions are surfaced, directors consume information passively rather than exercising oversight.
Failure 2: Compliance Metrics Substituting for Risk Metrics
Passing an audit or showing green on a controls framework tells the board very little about actual risk exposure. As ISACA's research notes, "compliance does not equal security" — and that gap is not semantic. An organization can be fully PCI DSS compliant and still carry significant unaddressed risk in areas the framework doesn't cover.
The board needs to see both: where baseline obligations are met, and where actual exposure sits beyond those baselines.
Compliance standing belongs on the board dashboard — but as an assurance signal in one section, not as the primary indicator of risk posture.
Failure 3: Format Instability Makes Trend Analysis Impossible
Dashboards that change metrics and framing every quarter destroy one of the board's primary oversight tools: the ability to compare. If the measurement changes each time, there is no trend — only a series of unrelated snapshots.
A board dashboard must be stable by design. The specific metrics matter less than their consistency. Four consecutive quarters of the same indicator builds a governance record. Swapping metrics each cycle resets that record to zero.
What Boards Actually Need from Cyber Reporting
The board's role is oversight, not operations. Directors aren't responsible for running the security program — they're responsible for asking whether risk is within appetite, whether management has adequate resources, and whether material issues are being escalated appropriately. NACD's guidance frames this as focusing on a "critical few" metrics tied to strategic oversight and risk appetite — not a comprehensive operational inventory.
Risk Posture in Business Terms
Before any technical detail, the dashboard needs to answer three questions:
- Which critical business objectives are most exposed right now?
- What is the estimated financial or operational impact if a top risk materializes?
- Is the trajectory improving, stable, or deteriorating?
These are governance questions. The answers need to be in business language — dollars, downtime, customer impact, regulatory exposure — not security jargon.
The Delta: What Changed Since Last Briefing
This is the single most underserved board need — and the one most dashboards skip entirely. The board should lead with the delta: what changed in the organization's risk profile since the last quarterly update, and what drove it.
If anything requires a board-level decision or acknowledgment, that surfaces here first. Numbers alone don't explain whether a trend reflects real improvement, delayed remediation, a business change, or risk quietly concentrating in one area. Plain-English commentary does that work — in a paragraph, not a page.
Risk Appetite as a Reference Point
Without defined thresholds, boards have no way to judge whether a given number is acceptable or alarming. Effective dashboards map every metric to an approved tolerance — "in appetite" or "outside appetite" — so directors can make that determination without needing a technical background.
Thresholds should be expressed in business terms:
- Maximum tolerable downtime for a critical service
- Maximum data loss window before regulatory or operational consequences
- Dollar bands for acceptable fraud or breach exposure
When a metric goes red, the board's job is to clarify impact, approve tradeoffs, and confirm accountable owners with dates. That's the line between oversight and operations — and a well-designed dashboard makes it obvious which side each decision falls on.
Separating Board-Level from Management-Level Information
Specific vulnerability counts, individual system patch status, and SOC alert volumes belong in management reports. The board dashboard aggregates these into outcome-level indicators:
- Are we detecting and recovering faster?
- Is our vendor ecosystem becoming riskier?
- Are we keeping pace with the threat environment?
The aggregation logic filters operational data through business service mapping — prioritizing the systems and services that matter most to the business, with exceptions tracked explicitly — rather than averages that mask where risk is actually piling up.
The Essential Components of an Executive Cybersecurity Dashboard
A well-structured board dashboard has five components, sequenced to move from risk posture to forward plan.
Component 1 — Risk Posture Snapshot
A heat map or top-5 enterprise cyber risks plotted by likelihood and business impact, mapped to strategic objectives. This is the opening panel. Keeping it to five is a discipline, not a compromise — adding more risks dilutes focus and buries what actually matters.
Component 2 — Trend Metrics (Quarter-on-Quarter)
A small, stable set of outcome-oriented indicators tracked over time. Recommended core metrics, with their governance "so what":
| Metric | What It Tells the Board |
|---|---|
| MFA coverage on critical assets | Are we shrinking the attack surface on the systems that matter most? |
| Mean time to detect (MTTD) + mean time to recover (MTTR) | Are we getting faster at finding threats and restoring operations? |
| Critical vulnerabilities unpatched beyond 30 days | Is remediation discipline keeping pace with exposure? |
| Phishing simulation click rate | Is our human risk improving or worsening? |
| Vendors with current security assessments | How well do we see our supply chain exposure? |
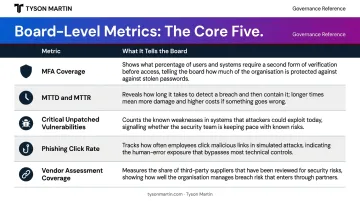
IBM's 2024 Cost of a Data Breach report puts the global average at 194 days to identify and 64 days to contain a breach — 258 days combined. MTTD and MTTR trend lines tell the board whether the organization is moving toward that benchmark or away from it.
Component 3 — Significant Events Since Last Report
For any incident at or above a defined severity threshold, the board needs five things in plain English:
- What happened
- What was the business impact
- What is the containment and recovery status
- What was the root cause
- Whether regulatory filing obligations were triggered:
- SEC Form 8-K: required within four business days of a materiality determination
- CIRCIA: 72-hour notice once the final rule takes effect
One paragraph per event. No technical deep-dives in this section.
Component 4 — Compliance and Assurance Snapshot
This panel summarizes current standing against primary obligations — NIST CSF, ISO 27001, HIPAA, PCI DSS, CMMC — along with the status of recent audits or penetration tests and the current cyber insurance posture.
It provides assurance that management is meeting baseline requirements. Think of it as the floor, not the ceiling — compliance standing supports the risk posture picture but doesn't replace it.
Component 5 — Forward-Looking Plan and Investment Needs
The dashboard closes with what is coming next: priority initiatives for the next two quarters, linked to measurable outcomes, and any budget or resource requests requiring board awareness or approval. Frame investment asks as options with explicit tradeoffs: for example, "Option A reduces ransomware exposure by 40% at $X; Option B achieves 65% reduction at $Y with a 90-day implementation lag." Boards make better decisions when the ask is tied to quantified risk reduction, not a list of capabilities.
Metrics That Belong on a Board Dashboard — and Why Trend Beats Trivia
The Selection Principle
Board-level metrics must be outcome-oriented, stable over time, understandable without a security background, and connected to business risk. If a metric can't trigger a decision, it has no place on a board dashboard.
Four components qualify a metric for board-level inclusion:
- A clear owner (a person who can make tradeoffs)
- A target threshold (what "good" looks like)
- A time window (weekly, monthly, quarterly)
- A decision it drives (fund, fix, accept, or escalate)
Why Trend Beats Trivia
A single quarter's reading tells the board almost nothing. A four-quarter trend line on MTTD tells the board whether the organization is becoming faster at detecting threats — which is a governance insight. Present 4–6 quarters of history for all core metrics. Directors need directionality and momentum, not snapshots.
The Third-Party Risk Gap
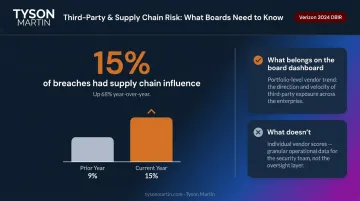
That same trend discipline applies to vendors — yet most board dashboards ignore supplier exposure entirely. Verizon's 2024 DBIR found that 15% of breaches had a supply chain interconnection influence — up 68% year over year from 9%.
The board dashboard should include an aggregate view of vendor security posture — not individual vendor scores, but a portfolio-level trend showing whether the organization's most critical suppliers are getting more or less risky over time.
Metric Proliferation Is a Governance Risk
The most common dashboarding mistake is adding new metrics each quarter. More indicators don't produce better oversight — they produce more noise and make trend analysis impossible. A board dashboard should hold to 8–12 stable indicators maximum. Anything beyond that is management reporting dressed up as board reporting.
Metrics to cut from board dashboards entirely:
- Raw vulnerability counts (spike when scanning improves, not when risk worsens)
- Blocked attacks and alert volume (more alerts can mean weaker prevention or mis-tuned tools)
- Audit findings closed without evidence of risk reduction
- Budget size as a success measure
Structuring the Right Reporting Cadence and Decision Rights
Three Reporting Formats
Effective programs use three distinct formats, each with a specific purpose:
Standing cyber brief (every board meeting): A two-page executive summary plus dashboard, running roughly 45 minutes. It covers top risks with movement, what changed since last briefing, a dashboard review, and decisions needed.
Material incident update (within 24 hours of materiality determination): A one-page incident sheet covering what happened, business impact, containment status, root cause, and disclosure obligations, followed by a briefing call. This format is triggered by events, not the calendar.
Quarterly or annual deep-dive: A 30-minute workshop on strategy, emerging threats, budget alignment, and tabletop exercises. This is where boards test their incident decision-making, not just receive slides.
Each format serves a distinct governance purpose. Mixing them — running incident updates inside the standing brief, or using deep-dives to cover operational metrics — causes directors to lose the thread of what requires a decision versus what's just a status update.
Decision Rights: The Layer Most Dashboards Omit
A well-designed dashboard without a decision rights framework produces passive reading, not governance decisions. The board dashboard must be paired with documented answers to five questions:
- Who accepts risk, and at what threshold?
- Who approves security exceptions, and for how long?
- Who decides budget tradeoffs when security competes with delivery?
- Who declares incident severity, and who can authorize system shutdown?
- Who owns vendor go/no-go decisions for critical suppliers?
Escalation thresholds should use a two-level structure: amber triggers for worsening trends over two cycles, near misses, or rising exception counts; red triggers for threshold breaches, repeat breaches, or expired exceptions without closure. These thresholds should be documented and tested before they are needed in a real crisis — not defined during one.
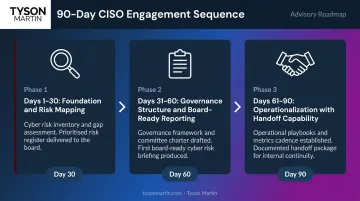
Organizations without a CISO capable of building this structure can use an interim or fractional CISO engagement to get it in place. A structured 90-day sequence works well:
- Days 1–30: Foundation and risk mapping
- Days 31–60: Governance structure and board-ready reporting
- Days 61–90: Operationalization with handoff capability
Preparing the Board for Governance Dialogue
With the right cadence and decision rights in place, the dashboard becomes a governance tool rather than a status report. Effective cyber reporting creates space for directors to ask the right questions — and to hold management accountable for the answers. The questions that signal genuine oversight:
- Is our risk posture within our defined risk appetite?
- What changed since last quarter, and why?
- Do we have the resources management needs to address our top risks?
- Have all material incidents triggered appropriate escalation and disclosure obligations?
If management needs 40 slides to answer those questions, the story isn't crisp yet. One page of executive summary plus one page of detail is the right discipline for the standing brief.
Frequently Asked Questions
What should be included in an executive cybersecurity dashboard for the board?
Five components: risk posture snapshot, quarter-on-quarter trend metrics, significant events since last report, compliance and assurance summary, and a forward-looking investment plan. All five should be framed in business language — dollars, downtime, operational impact — rather than technical detail.
How often should a CISO present cybersecurity updates to the board?
Best practice is three cadences:
- Standing brief at every board meeting
- Immediate update within 24 hours of any material incident determination
- Annual deep-dive for strategy, threat landscape, and budget alignment
Consistent format — not meeting frequency — drives board confidence over time.
How is a board-level cybersecurity dashboard different from a management-level one?
A board dashboard shows outcome-level trend indicators and risk posture in business terms. Management dashboards track operational metrics — vulnerability counts, alert volumes, system-specific patch status — that are too granular for governance oversight. The board version aggregates operational data through the lens of business impact and critical asset exposure.
How do you translate technical cybersecurity metrics into language a board can act on?
Pair each metric with a one-line "so what" statement connecting the number to business risk or operational continuity. Use the pattern: "Because we improved X, we reduced the chance of Y, which protects Z." Always show trend rather than a one-time snapshot.
What questions should board members ask when reviewing a cybersecurity dashboard?
Directors should ask:
- Is our risk posture within our defined risk appetite?
- What changed since last quarter, and why?
- Do we have adequate resources to address our top risks?
- Have all material incidents triggered the appropriate escalation and disclosure obligations?
How many KPIs should be on a board-level cybersecurity dashboard?
Eight to twelve stable, outcome-oriented indicators at most — with five core board-level metrics kept consistent across every reporting cycle. Consistency across quarters matters more than the specific metrics chosen, because trend analysis is the primary purpose of the board dashboard.