The volume isn't the problem on its own. The problem is that most of that volume is operational detail that directors lack context to interpret — and buried somewhere inside it are the two or three items that actually require board-level judgment.
Board reporting dashboards should solve this. Most don't, because they're built for the teams producing them, not the directors reading them. The result is noise instead of oversight.
This article covers practical best practices for building a board reporting dashboard that surfaces trend over trivia, supports defensible decision-making, and holds up under regulatory scrutiny in 2026.
Key Takeaways
- Every board dashboard must answer three questions: current risk posture, what changed this quarter, and what requires board action now
- Fewer, stable metrics beat frequent rotation — directors need trend data, not a moving scorecard
- Every metric must connect to strategy, risk appetite, or a decision threshold — not just operational activity
- Governance and escalation logic must be built into the dashboard before an incident occurs
- A well-structured dashboard reduces time spent on status updates and increases time spent on judgment
What Is a Board Reporting Dashboard (And Why Most Get It Wrong)
A board reporting dashboard is a structured, recurring summary of the metrics, trends, and risk indicators a board needs to fulfill its oversight responsibilities. That definition sounds obvious. The gap between it and what most organizations actually produce is significant.
The failure mode is consistent: organizations take internal management dashboards and present them to the board unchanged. Directors end up absorbing operational data — patch counts, training completion rates, alert volumes — without the context to evaluate what any of it means for the business. The actual decisions that require board-level judgment get buried.
As Tyson Martin describes it, it's like driving with a perfect speedometer while the fuel gauge is broken. Everything looks fine on the surface — but the real exposure isn't showing. That distinction is where governance either holds or breaks down.
The purpose distinction matters:
- Management dashboards track operational activity — what the security or IT team is doing day to day
- Board dashboards track governance posture — whether the organization is operating within its stated risk appetite and whether management has the situation under control
A board dashboard is governance infrastructure. Its job is not to prove that a team is busy. It is to give directors the information they need to exercise oversight, ask the right questions, and make or delegate decisions with confidence.
Sixty percent of directors say their board packs are too operational at the expense of strategy, and 44% say they're light on implications. When directors can't connect what they're reading to a decision or risk judgment, the reporting has failed its purpose — regardless of how much data it contains.
What Boards Actually Need to See: Metrics That Matter in 2026
The Metric Selection Principle
Board-level metrics should be stable quarter to quarter, limited to 8–12 indicators, and tied directly to strategic objectives, risk appetite thresholds, or regulatory obligations. Not chosen because they're easy to pull.
Tyson Martin's guidance is direct: "If you show 25 numbers, you're basically asking directors to guess what matters." The constraint of 8–12 forces teams to prioritize. Every metric in that set should pass a clear test — it must trigger a decision, allocate resources, or prompt action. If it can't, it belongs in management reporting.
Cyber and Technology Risk Metrics
With SEC cybersecurity disclosure rules now in effect — adopted July 26, 2023 under Release No. 33-11216 — boards in regulated industries have a compliance obligation, not just a governance preference, to understand their organization's cyber risk posture. Item 106 requires disclosure of how the board is informed about cybersecurity risks and which committee holds oversight responsibility.
The enforcement record reinforces the stakes. In 2024, the SEC charged R.R. Donnelley with failing to design effective disclosure controls to report relevant cybersecurity information to management — a $2.125M settlement. Four other companies (Unisys, Avaya, Check Point, Mimecast) were charged with materially misleading cyber disclosures, with combined penalties exceeding $7M.
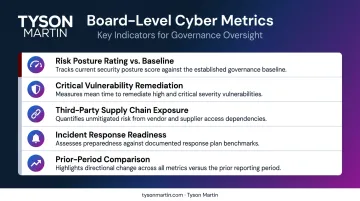
Core cyber metrics for a board dashboard:
- Risk posture rating vs. baseline: Is overall exposure improving, flat, or worsening quarter over quarter?
- Critical vulnerability remediation: Remediation time on crown-jewel systems and percent past due by severity and asset tier — not just "percent patched"
- Third-party/supply chain exposure: Critical vendors out of tolerance, exception aging, and any vendor whose failure could materially disrupt a core service
- Incident response readiness: Based on tested behaviors (tabletop completion, escalation speed, backup recovery checks), not plans on paper
- Prior-period comparison on every metric: Directors need to assess trend, not just a snapshot — a number without context invites the wrong question
NACD's 2026 cyber-risk toolkit organizes board-level metrics into five categories: threat environment, economic cyber-loss exposure, cyber-risk profile, supply-chain exposure, and business/operational decisions. That structure is a more useful organizing frame for a board dashboard than anything sourced from a SOC tool.
Strategic and Operational Performance Metrics
Cyber metrics don't stand alone — they sit alongside strategic and financial indicators that give the board a full picture of organizational health. A complete board dashboard also includes:
- Progress against strategic plan milestones
- Financial health indicators: operating cash flow, key budget variances
- Compliance posture across applicable regulatory frameworks
- Significant operational risks with named owners and resolution timelines
Each metric needs a clearly defined tolerance band. Green/amber/red status indicators are functional only when the thresholds behind them were agreed upon by the board in advance — not set unilaterally by management and presented as fact.
Dashboard Design Principles: Showing Trend, Not Trivia
Stability Is a Feature
A board reporting dashboard should use the same metrics, the same definitions, and the same format quarter after quarter. This is intentional. Directors need to see direction of travel — whether risk is getting better, holding steady, or deteriorating — and that requires consistency across cycles.
Rotating metrics to highlight wins is a red flag. It signals that the dashboard is being managed rather than governed.
That principle of "showing trend, not trivia" translates into three concrete design choices:
- Quarter-over-quarter trendlines rather than point-in-time snapshots
- Explicit change indicators — which risks increased, which decreased, and why
- Stable format so directors aren't relearning the scorecard at the start of every meeting
The Single-Page Executive View
The board-facing layer of any dashboard should fit on one page or one screen. What belongs there:
- Five to seven metrics with trend arrows and board-approved thresholds
- Top risks — what changed, what's stuck, what decision is needed
- Incidents and near-misses, including third parties
- A short "what changed since last period" summary (two paragraphs maximum)
- A clearly labeled "Decisions requested" box with one to three items, each with options and a recommended path
What does not belong on the board page: raw scan counts, tool feature lists, vendor catalogs, long control narratives, or anything that requires technical expertise to interpret. Those belong in appendices — available on request, not pushed to the boardroom.
Plain Language Is Non-Negotiable
Every metric label, status indicator, and commentary must be written for a non-technical director. Acronyms, tool-specific jargon, and references to internal systems have no place on a board dashboard.
The translation rule is straightforward:
| Technical Finding | Board-Ready Language |
|---|---|
| Vendor lacks MFA for admin access | A compromised admin account could expose customer data and disrupt operations |
| Critical patch coverage at 74% | One in four systems is unprotected against known attacks |
| SIEM alert volume up 40% | Threat activity is increasing; current detection capacity is being tested |
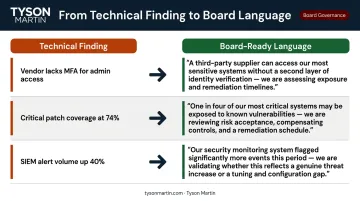
Technical findings become harm statements. Control gaps become business impact. The board governs rather than decodes.
A useful test: can a director scan the dashboard in under 60 seconds and identify what's in tolerance, what's out of tolerance, and what requires their input? If the answer is no, the dashboard is still doing the CISO's job — not the board's.
Governance, Escalation Thresholds, and Decision Rights
Why Dashboard Governance Matters
A board reporting dashboard that's manually assembled, inconsistently sourced, or editable without version control cannot be trusted — and in regulated industries, that's a disclosure risk. The R.R. Donnelley enforcement action is a direct example: the SEC found the company failed to design effective controls to route relevant cybersecurity information to the people responsible for disclosure decisions.
Dashboard governance means defined data owners, a documented production process, and a clear audit trail. It's the difference between a defensible reporting artifact and a slide deck that someone updated the morning of the meeting.
Escalation Logic as a Design Element
Escalation thresholds should be embedded in the dashboard before pressure arrives, not established during an incident. Here's how that maps in practice:
| Trigger Level | Condition | Action |
|---|---|---|
| Management control | Limited impact, short duration, low data sensitivity | Management resolves within policy |
| Executive escalation | Impacts critical processes or creates customer friction | Executive approval required |
| Board escalation | Material outage, regulated data exposure, or brand damage | CEO and board committee chair notified quickly |
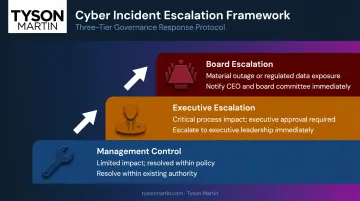
Two trigger types drive board notification in practice: amber (worsening trend over two cycles, near-misses, rising exception counts) and red (threshold breach, repeat breach, expired exceptions without closure).
Decision Rights Clarity
Every item on a board dashboard needs a clear designation:
- For board decision — requires explicit approval or direction
- For board awareness — material information, no action required at this time
- Under management control — board informed, management owns resolution
Without that designation, directors absorb information without knowing whether they're being asked to act, note, or do nothing at all. That ambiguity is how boards end up either micromanaging operations or missing the moments they should have weighed in.
When there's no permanent CISO in place, this governance structure typically has no internal owner — which means the cadence slips, the framework drifts, and the dashboard loses defensibility from one reporting cycle to the next. That's the gap a board advisor or interim CISO is positioned to fill.
Common Board Dashboard Mistakes to Avoid
The Vanity Metric Trap
Activity metrics show up on board dashboards constantly: training completion rates, number of patches deployed, blocked attack counts. These describe what the team is doing. They don't tell the board whether the organization is safer or more exposed than last quarter.
The distinction Tyson Martin draws is direct: "99% training completion" means little if phishing reporting rates are low and privileged access is loose. A board that accepts activity metrics as evidence of risk reduction is approving a false sense of control.
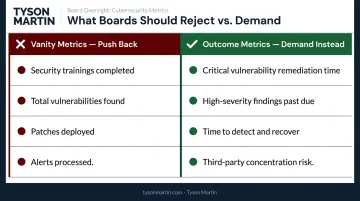
Vanity metrics to push back on:
- Number of security trainings completed
- Total vulnerabilities found
- Patches deployed in the quarter
- Alerts processed or blocked
Outcome metrics to demand instead:
- Critical vulnerability remediation time on crown-jewel systems
- Percent of high-severity findings past due by asset tier
- Time to detect, contain, and recover from incidents
- Third-party concentration risk tied to specific business services
Metric Overload
The vanity metric problem compounds when dashboards just keep growing. Spencer Stuart's 2024 Director Pulse Survey found 70% of directors say total hours spent on board obligations increased, with public-company directors averaging 242 hours per year. Adding metrics to an already dense dashboard increases cognitive load without improving oversight.
A disciplined limit of 8–12 metrics forces management to prioritize — and eliminates the ability to hide behind volume.
Timing and Distribution Failures
A board dashboard delivered 24 hours before a meeting is not a governance tool. NACD/Board Intelligence research puts the director preference at seven days before the meeting, and 15% of directors say materials are not distributed early enough for adequate review.
Two practices close this gap:
- Distribute with lead time: Seven days before the meeting is the floor, not the goal. Directors need time to read, reflect, and prepare questions.
- Build an out-of-cycle trigger: Define in advance which escalation thresholds or material events require notification between scheduled meetings — don't leave that to judgment in the moment.
NACD's 2026 guidance reinforces this: structured quarterly reporting plus ad hoc updates after material incidents or significant changes in risk exposure.
Frequently Asked Questions
What should a board report include?
A board report should cover current risk posture, strategic and financial performance against plan, escalated risks above agreed tolerance, and a clear summary of what changed since the last period. Each item should be designated as: for decision, for awareness, or under management control.
What is a dashboard for reporting?
A reporting dashboard is a structured visual display of key metrics and trends that lets decision-makers assess organizational health at a glance. For boards, it supports oversight and governance — designed for directional clarity, not operational depth.
How often should a board reporting dashboard be updated?
Most boards receive a refreshed dashboard quarterly, aligned to meeting cycles. A standing process for out-of-cycle notification should exist for any metric that crosses a pre-agreed escalation threshold or any material incident — NACD's 2026 guidance recommends exactly this cadence.
How do you avoid information overload on a board dashboard?
Agree on a stable, limited set of metrics (typically 8–12), design the board layer as a single-page executive view, and put operational drilldowns in management-facing reports that are available on request rather than pushed to the board. The board page should be scannable in under 60 seconds.
What are the four types of reports?
The four types are: informational (status updates), decision papers (requiring board action), exception reports (items outside tolerance), and strategic reports (progress toward long-term objectives). A mature dashboard draws on all four in a single coherent view.