Introduction
Most boards receive too much data and too little insight. Directors sit down to a thick board pack — sometimes hundreds of pages, according to Harvard Law School's research on board overload — and spend their limited meeting time parsing operational detail instead of governing.
The problem isn't a lack of information. It's that management defaults to reporting what it tracks, not what the board needs to decide.
A well-designed board reporting dashboard fixes this. It compresses the organization's most critical signals into a single, scannable view: one that establishes shared context before the meeting starts and tells directors where their attention belongs. That requires intentional design — not another layer of charts.
This guide covers what a board reporting dashboard actually is, what it must include (the technology and cyber risk layer most dashboards omit among them), how to design one that drives decisions, and the mistakes that undermine most dashboards before they're ever presented.
Key Takeaways
- A board dashboard is a single-page governance tool — not an operational report or data dump
- Boards need outcome metrics tied to decisions, not activity counts or IT status updates
- Treat cyber and technology risk as a board-level governance responsibility — not optional IT reporting
- Stable, consistent metrics over time are more valuable than comprehensive but constantly changing ones
- Every metric should answer one question: board action required, or is management handling it?
What Is a Board Reporting Dashboard and Why Does It Matter?
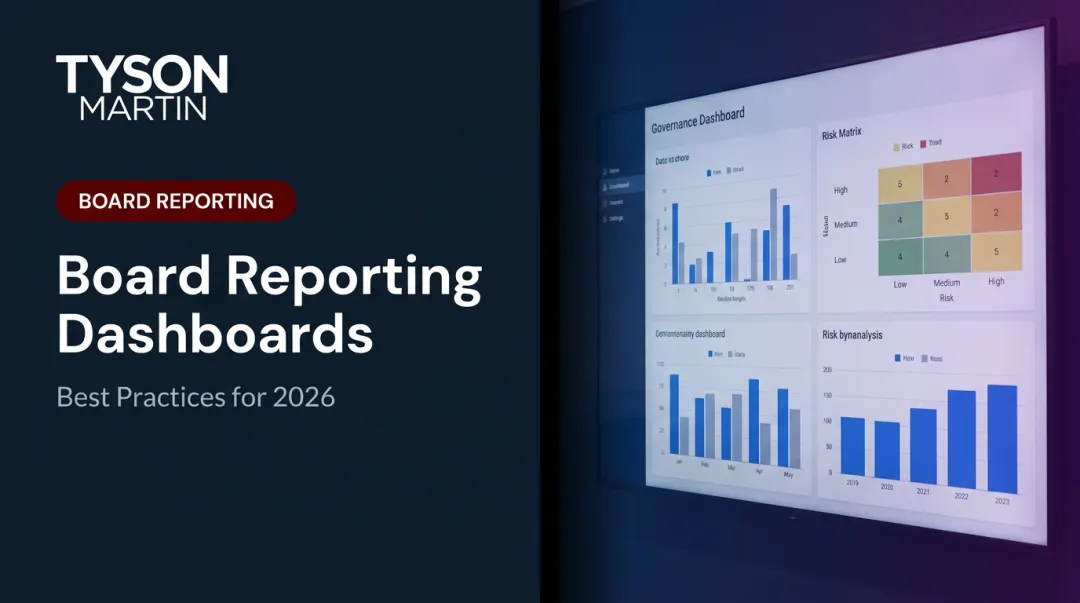
A board reporting dashboard is a single-page visual summary of organizational health across strategy, performance, risk, and governance. Its job is to give directors an at-a-glance view of what matters before they review supporting materials.
As dashboard design authority Stephen Few defines it: a dashboard displays the most important information needed to achieve objectives, consolidated on a single screen so it can be monitored at a glance. Applied to governance, that means one page. No exceptions.
Where It Fits in the Board Pack
The dashboard sits near the front of the board pack. It establishes shared context before the meeting begins, aligns management and directors on what matters most, and prevents the first thirty minutes of every meeting from becoming a fact-finding exercise.
What a board dashboard is not matters just as much as what it is:
- An operational report with granular KPIs for each business unit
- A management tool repurposed for the boardroom
- A data dump designed to show management is tracking everything
- A compliance checklist dressed up as governance
Its sole function is to tell directors where to focus their attention — and to surface the decisions that require their involvement.
What Boards Actually Need vs. What Management Tends to Send
The most persistent mismatch in board reporting comes down to this: management reports what it measures internally, and boards receive the output of management processes rather than the input for governance decisions.
The Information Pyramid Problem
Organizational reporting works like a pyramid. Management reporting — detailed operational metrics, activity counts, project status — belongs at the base. Board-level reporting belongs at the apex: the smallest, highest-order set of indicators that answer whether the organization is on track, at risk, or facing a decision.
Most board packs invert this structure. Boards end up buried in base-layer data.
The technology and cyber risk layer is where this failure is most acute. CISOs and CIOs commonly bring boards:
- Total vulnerability counts (which spike when scanning improves, not when risk increases)
- Blocked attack volumes (more alerts can signal weaker prevention, not stronger)
- Patch completion rates (activity metrics, not outcome metrics)
- Audit findings closed (closure can be paperwork; the same failure mode may remain)
- Training completion percentages (99% completion won't stop a wire fraud)
None of these tell directors whether risk is improving or deteriorating. None surface a decision. They describe IT output — which is useful for management, but creates noise at the governance level.
What the Board Actually Needs
Boards govern; they don't manage. The dashboard should surface decisions that belong to the board and confirm that everything else is being handled effectively below them.
Each metric should implicitly answer one of two questions:
- Does the board need to act on this? (fund it, decide it, escalate it)
- Is this confirmation that management has it under control?
A useful filter: if the metric lives in a management team meeting, it doesn't belong on the board dashboard.
The Four Categories Every Board Dashboard Should Cover
A well-structured board dashboard organizes across four quadrants. Each answers a distinct governance question.
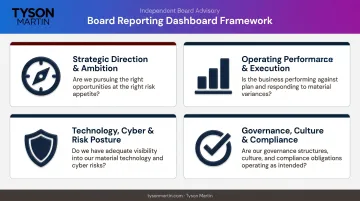
Strategic Direction and Ambition
Are we delivering on why we exist?
This section should include two to four metrics tied to the organization's core commercial purpose and longer-term goals — revenue growth versus plan, market position, customer value delivered, or strategic initiative progress. Keep it to what directors need to confirm the strategy is still valid and on track.
Operating Performance and Execution
Is the business executing well enough to fund the strategy?
This is the in-year engine check. Short-term financial and operational indicators — operating cash flow, margin, key program milestones — that confirm whether execution is on track. The discipline here is restraint: include only the minimum set that management can actually influence and that directors need to see.
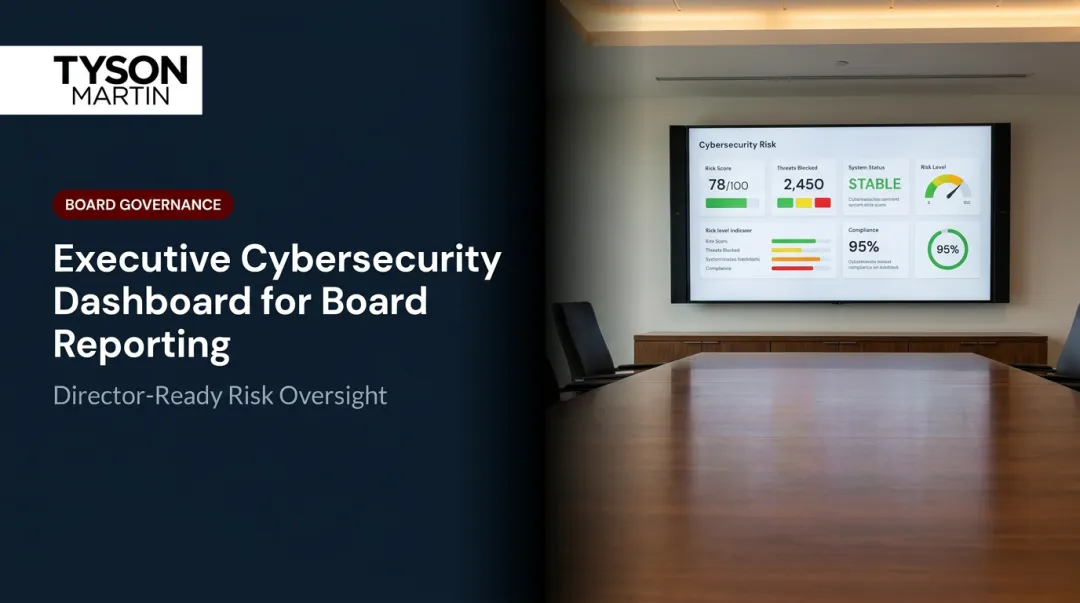
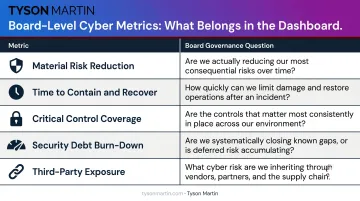
Technology, Cyber, and Risk Posture
Is our risk posture improving or deteriorating?
This category is no longer optional. SEC rules adopted in 2023 require public companies to disclose material cyber incidents and describe cyber risk governance annually — making board-level cyber oversight a disclosure obligation, not a best practice. NIST CSF 2.0, released in February 2024, reinforced this by adding a dedicated "Govern" function, framing cybersecurity explicitly as enterprise risk.
Board-appropriate cyber metrics look nothing like what most CISOs currently present. Five outcome metrics belong at the board level:
| Metric | What It Answers |
|---|---|
| Material risk reduction | Are top risk scenarios improving — and what decision is needed? |
| Time to contain and recover | How long are we exposed when something happens? |
| Critical control coverage on crown jewels | Are our highest-value systems adequately protected? |
| Security debt burn-down | Is known, prioritized risk declining? |
| Third-party exposure on critical vendors | Do our most important suppliers represent growing or shrinking risk? |
This section must also include a "what changed since last briefing" indicator. Directional trend matters more than point-in-time counts, and escalation thresholds should be visible so directors know immediately whether a metric requires monitoring, discussion, or decision.
Governance, Culture, and Compliance
How is the organization conducting itself?
This quadrant covers regulatory compliance status, ethics and whistleblower activity trends, culture indicators, and any matters that could threaten the organization's license to operate. In regulated industries — financial services, healthcare, and retail — it should also surface specific regulatory posture updates and open audit findings, with clear status on whether remediation is on track.
Metrics to include:
- Compliance score trends and direction of movement
- Residual risk index changes since the last briefing
- Percentage of critical vendors with current assessments
- DR and cyber exercise readiness against recovery objectives
The purpose is confirmation — that obligations are being met and no open issues require board-level intervention.
How to Design a Board Dashboard That Drives Decisions
Design is where most dashboards either earn their place or fail quietly.
Apply the Single-Page Constraint
A dashboard that doesn't fit on one page is a report. That constraint is the point — forcing everything onto one page requires the hard editorial decisions that separate signal from noise. PwC's board communication guidance recommends exactly this — a one-page dashboard of key metrics that gives directors a consolidated view before they reach the supporting materials.
Use Questions, Not Labels
Replace section headers like "Cybersecurity" or "Financial Performance" with questions: "Is our risk posture improving?" or "Are we on track to hit this year's strategic goals?" Questions force data to earn its place. They orient directors toward insight and make it immediately obvious when a metric isn't actually answering anything.
Stabilize the Metric Set
The dashboard gains its real value over multiple meetings when metrics are consistent and comparable. Changing what gets reported every quarter destroys the board's ability to see direction of travel.
In practice, this means holding the core scorecard to five board-level outcome metrics across every reporting cycle. Supporting metrics can rotate quarterly for deeper dives — ransomware readiness one quarter, third-party concentration the next. A few operational rules keep the stability credible:
- Keep the core five metrics identical from meeting to meeting
- Disclose any change in a metric's definition explicitly, in the narrative
- Reset the baseline when scope expands and explain the reason
- Treat rotating supporting metrics as supplements, never replacements
Separate Data from Narrative
The dashboard shows numbers, trend indicators, and escalation status. A short accompanying narrative — two to three pages, written by the CEO or CISO — explains what changed, why it matters, and what's being done. Mixing the two on a single page weakens both: the data loses clarity and the narrative loses its accountability function.
The narrative structure that works: what changed since last meeting → what it means → what management is doing → what support is needed → what happens if action slips.
Build Escalation Thresholds In From the Start
For each metric, define in advance what level of performance triggers board awareness, board discussion, or board decision. Without thresholds, the dashboard is a reporting artifact. With them, it's a governance tool.
The framework should distinguish two trigger levels:
- Amber: worsening trends over two cycles, rising exception counts, near-misses
- Red: threshold breaches, repeat breaches, exceptions expiring without closure
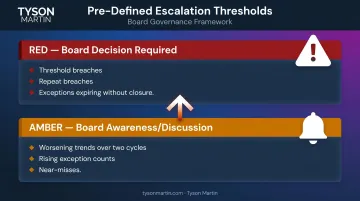
Pre-defining these prevents both silence and overreaction. Bad news reaches the board through criteria set in advance, not through whoever happens to be loudest in the room.
For organizations building their first dashboard or redesigning an existing one, a board advisor with governance and technology risk experience can accelerate the threshold-setting process and ensure the metric set holds up under real incident conditions, not just routine reporting.
Common Mistakes That Undermine Board Reporting Dashboards
Operational Metrics Dressed as Board Metrics
The most common error is reporting what's easy to measure rather than what's meaningful at the governance level. Vulnerability counts, training completion rates, audit findings closed — these are management metrics. Presenting them to the board creates the appearance of oversight without the substance.
The test: if a metric would belong in a management team meeting, it probably doesn't belong on the board dashboard.
The Missing Technology and Cyber Risk Layer
Many board dashboards cover financial performance and strategy execution adequately, but leave technology and cyber risk to an annual CISO briefing or a standalone audit committee update. The Diligent Institute found only 5% of 4,149 analyzed companies had cybersecurity experts on the board. Companies with advanced cybersecurity ratings, by contrast, generated nearly four times the shareholder value of lower-rated peers — making this gap both a governance failure and a financial one.

Directors who receive cyber updates only annually cannot provide effective oversight between those touchpoints — and cannot meet the SEC's expectations for ongoing board-level cyber governance.
Metric Instability
When dashboards are redesigned every few meetings, directors lose their reference points. Without a stable baseline, trend is invisible. A single quarter's numbers tells you nothing. Three or four quarters of consistent data starts to tell a story — giving directors the pattern recognition to ask sharper questions and challenge management assumptions.
Frequently Asked Questions
What is the purpose of a board data dashboard?
A board data dashboard is a single-page governance tool that gives directors an at-a-glance view of organizational health across strategy, performance, risk, and compliance. Its purpose is to enable focused meeting discussion and faster escalation of issues requiring board action — not to prove that management is tracking everything.
What is the 5-second rule for dashboards?
A well-designed dashboard communicates its most critical insight almost immediately upon opening — if the key takeaway requires more than a quick scan, the dashboard is too dense or poorly structured. Stephen Few's foundational definition puts it plainly: the most important information should be visible at a glance, without requiring the reader to interpret their way to an insight.
How many metrics should a board reporting dashboard include?
Keep the dashboard to a carefully chosen set of high-level indicators — roughly eight to twelve — organized around the board's key oversight questions. Within that set, five core outcome metrics should remain stable across every reporting cycle. Supporting metrics can rotate for thematic depth, but the core scorecard stays fixed.
What is the difference between a board dashboard and an executive dashboard?
An executive dashboard supports operational decision-making with granular, real-time data across functional areas. A board dashboard provides a strategic and governance-level view designed to answer whether the organization is on track and whether any decisions require board action.
How often should a board reporting dashboard be updated?
Update the core dashboard on the same cadence as board meetings — typically quarterly — and include a brief "what changed since last briefing" notation to make trend and movement immediately visible. Organizations with active SEC disclosure obligations may run committee-level reviews monthly, reserving full-board sessions for deeper quarterly examination.