Introduction
Most organizations measure dozens of cybersecurity data points. Yet boards still walk out of briefings unsure whether the company is more or less exposed than last quarter.
The problem is rarely a lack of data. It's the wrong data, framed in language that means nothing to the people responsible for governance.
Directors sit through security updates, nod at the charts, and still can't answer basic governance questions: What are our top risks? Who owns them? What would we do in the first hour of a serious incident?
When reporting turns into a status recitation — tools deployed, patches applied, training completed — boards hear activity, not risk.
This guide is written for board members, CEOs, COOs, audit and risk committee chairs, General Counsel, and CISOs preparing executive briefings. It covers what cyber risk metrics actually are, why the KRI/KPI distinction matters, which metrics belong in front of leadership, and how to build a reporting program that shows trend rather than trivia.
Key Takeaways
- Cyber risk metrics measure exposure and business impact — not just security activity
- KRIs warn before incidents occur; KPIs measure performance after — boards need both, with heavier reliance on KRIs
- The six metrics every board should track: MTTD/MTTR, financial loss exposure, patch compliance, third-party risk score, incident cost, and risk posture trend
- A board-level dashboard needs 5–8 strategic indicators with pre-agreed thresholds, not a raw operational data feed
- Consistent methodology across reporting periods is what makes trend analysis trustworthy
What Are Cyber Risk Metrics?
Cyber risk metrics are structured, repeatable data points that tell leadership whether security controls are working, where risk is concentrated, and whether overall security posture is improving or degrading over time.
The over time dimension is what separates them from general IT performance data. A firewall alert count tells you how busy the system was. A cyber risk metric tells you whether the organization is more or less likely to suffer a costly event than it was last quarter.
Activity vs. Exposure
Not all cybersecurity metrics are cyber risk metrics. The distinction is consequential:
- Operational/activity data — alert volumes, firewall logs, tickets closed — measures what the security team did
- Cyber risk metrics — exposure levels, vulnerability age, financial loss estimates — measures what the organization faces
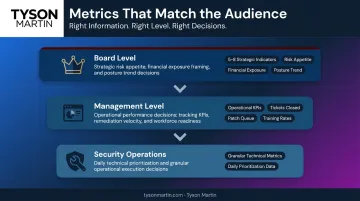
Boards need the second category. Activity data belongs at the management and operations level, where it drives prioritization. Presenting it at the board level without translation produces what Tyson Martin calls "weather reports" : lots of green, yellow, and in-progress designations that tell directors nothing about whether the business is actually safer.
The NIST Foundation
NIST SP 800-55 Vol. 2 (published December 2024) provides the foundational federal guidance for building a formal metrics program. It replaced the 2008 Rev. 1 edition with a more flexible measurement structure.
The methodology connects security controls to organizational objectives — which makes it the right foundation for any metrics program that needs to hold up to auditors or regulators.
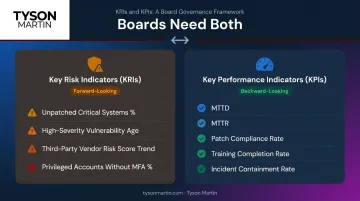
KRIs vs. KPIs: Understanding the Difference
This distinction is where most board reporting breaks down. Organizations default to KPIs — performance data — while boards actually need KRIs: risk signals. Both have a role. Conflating them produces reports that describe what happened rather than warn what is coming.
Key Risk Indicators (KRIs)
KRIs are forward-looking signals that warn when cyber risk is approaching or exceeding the organization's agreed tolerance thresholds. They answer: are we exposed? before an incident occurs.
Representative KRIs:
- Percentage of critical systems without current patches as of a given date
- Number of high-severity vulnerabilities unresolved beyond 30 days
- Trend in third-party vendor risk scores
- Percentage of privileged accounts without MFA enabled
KRIs are the governance layer. Boards set risk appetite and need early warning signals to exercise oversight. A KRI crossing a pre-defined threshold should trigger an escalation conversation — not a post-incident review.
Key Performance Indicators (KPIs)
KPIs are backward-looking measures of security program execution. They answer: how well did we perform? They're most useful for management accountability and trend analysis within the security function.
Representative KPIs:
- Mean Time to Detect (MTTD) and Mean Time to Respond (MTTR)
- Patch compliance rate within defined SLA timeframes
- Security training completion rate
- Incident containment rate
The risk with KPI-only board reporting is structural: when directors receive only performance data, they can judge the security team's execution but have no signal that exposure is building. Boards need both layers — KRIs to catch rising risk before an incident, and KPIs to verify the team can respond when one occurs.
Three Categories of Cyber Risk Metrics
| Category | Primary Audience | Examples |
|---|---|---|
| Operational | Security teams, managers | Alert volumes, endpoint coverage, patch queues |
| Compliance | Legal, risk, audit | MFA adoption, encryption coverage, policy exception counts |
| Risk-based / Strategic | Board, C-suite | Financial exposure estimates, posture trend, peer benchmarks |
Operational metrics are too granular to present directly to boards. Without aggregation and context, alert volumes and patch queues create noise rather than insight.
Compliance metrics matter most in regulated industries — financial services, healthcare, and retail — where regulatory penalties can be quantified and tracked alongside cyber risk posture.
Risk-based and strategic metrics are where board-level conversations happen. They translate security program data into the language executives actually use: financial exposure, trend direction, and how the organization compares to peers. That translation is what makes resource allocation and risk appetite decisions defensible.
Key Cyber Risk Metrics Every Board Should Know
MTTD and MTTR
Mean Time to Detect and Mean Time to Respond are the paired KPIs that reveal how quickly threats are identified and contained. According to IBM's 2025 Cost of a Data Breach Report, the average breach lifecycle — time to identify and contain — reached a nine-year low of 241 days globally.
Even at a nine-year low, the average organization takes over eight months to close a breach. The trend matters more than any single reading — a board that sees MTTD improving quarter over quarter has evidence the security program is maturing, while stagnation is an escalation question.
Financial Loss Exposure by Threat Scenario
This is the metric that translates risk into board language. IBM's 2025 report puts the global average cost of a data breach at $4.44M — down 9% from the prior year, but still a significant reserve and resource-allocation consideration.
Ransomware tells a more complex story. Chainalysis data for 2025 shows total on-chain ransomware payments fell approximately 8% to $820M, yet the median payment increased 368% — from $12,738 in 2024 to $59,556 in 2025. Coveware's Q3 2025 incident-response cases put the average ransom payment at $376,941.
Aggregate totals can fall while individual exposure rises sharply. Boards should quantify financial exposure by the organization's most likely threat scenarios — ransomware, data breach, business interruption — to anchor both risk appetite decisions and reserve adequacy.
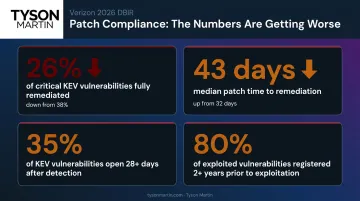
Patch Compliance Rate and Vulnerability Age
The Verizon 2026 Data Breach Investigations Report puts vulnerability exploitation at 31% of breach initial access cases, up from 20% the prior year. More telling:
- Only 26% of critical vulnerabilities in the CISA Known Exploited Vulnerabilities catalog were fully remediated in 2025 (down from 38%)
- Median time to fully patch these vulnerabilities rose to 43 days, up from 32
- 35% of KEV vulnerabilities remained open 28 days after detection
- 80% of vulnerabilities with persistent exploitation were registered in the CVE database at least two years before exploitation
A lagging patch rate is one of the clearest KRIs a board can monitor. These numbers confirm the direction: remediation is slowing while exploitation is accelerating — a gap that directly informs risk appetite conversations.
Third-Party and Vendor Risk Score
The same Verizon 2026 DBIR reports that 48% of total breaches involved a third party — a 60% increase from the prior year's 30%. Nearly half of all breaches now trace back to the vendor ecosystem rather than internal controls.
For any organization with significant vendor relationships, a third-party risk score trend is an exposure indicator for the entire ecosystem. The metric should focus on business-critical vendors first — the suppliers whose failure or compromise could take down core operations — rather than treating all vendors equally.
Incident Rate and Cost per Incident
Frequency of confirmed incidents combined with their average fully-loaded cost — direct response, legal, regulatory, reputational — supports ROI analysis for security investments and a check on whether current reserves are adequate. A security team that closes more incidents quickly at lower per-incident cost is demonstrably more effective than one reporting fewer incidents with no cost data attached.
Risk Posture Trend Over Time
Of all the metrics on a board dashboard, the risk posture trend line carries the most weight. Not a point-in-time snapshot — a consistent, comparable trend showing whether overall exposure is improving, stable, or degrading quarter over quarter.
The operative word is consistent. A posture trend is only meaningful if the methodology doesn't change between periods. When metrics shift — different definitions, different scope, different data sources — movements in the dashboard reflect changes in measurement, not changes in actual exposure. Stable methodology is a governance asset. Boards should ask whether the definitions behind the dashboard have changed before drawing conclusions from any quarter-over-quarter movement.
How to Build a Cyber Risk Metrics Program Boards Can Trust
Tier the Audience Before Selecting Metrics
The most common failure mode is presenting the same undifferentiated dashboard to all three audiences:
- Board level: 5–8 strategic indicators tied to risk appetite — material risk reduction, containment and recovery time, critical control coverage on highest-value systems, security debt burn-down, and third-party exposure on most critical vendors
- Management level: Operational KPIs showing program execution — tickets closed, systems scanned, training rates, patch queue status
- Security operations: Granular technical metrics driving daily prioritization
Each tier needs different information to make different decisions. Boards that receive operational noise instead of strategic clarity cannot govern effectively.
Define Thresholds Before the Briefing
Metrics only drive decisions when paired with pre-agreed red/yellow/green thresholds tied to the organization's risk tolerance. Without this, boards cannot distinguish a routine data point from an urgent governance issue.
Thresholds should be specific, not vague — "customer portal restored within 6 hours of a major outage" rather than "minimize downtime." When colors connect to board-approved thresholds, the meeting shifts from interpreting risk to deciding what to do about it.
Report Trend, Not Isolated Data Points
A single quarter's metric reading is noise. Three or more consistent periods create a signal. As Tyson Martin has noted in board reporting engagements: "Stability matters — if metrics change every month, they stop being useful." A dashboard that a board can review with the same structure every quarter builds governance confidence faster than any redesign.
When to Bring in External Expertise
Organizations navigating a leadership transition, M&A due diligence, a post-incident rebuild, or a first formal board reporting structure often need outside structure fast. An experienced interim or fractional CISO — such as Tyson Martin — can establish the foundation quickly. That typically means:
- A structured metrics program with clear escalation thresholds
- A 90-day plan with named owners and measurable outcomes
- An inspectable one-page dashboard showing trend, decisions needed, and progress in plain English
Align to Sector-Specific Regulatory Requirements
Sector shapes which metrics carry the most weight with regulators and auditors:
- Financial services: Risk appetite quantification and board oversight documentation carry heightened weight
- Healthcare: HIPAA Security Rule requirements include risk analysis, audit controls, and information system activity review as core compliance metrics
- Retail: PCI DSS v4.0.1 requires targeted risk analysis and compliance validation — patch status and access control coverage are particularly visible
- Public companies: The SEC's 2023 cybersecurity disclosure rules require annual governance disclosures and Form 8-K reporting of material incidents within four business days of determining materiality
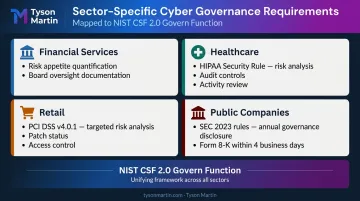
NIST CSF 2.0's Govern function — covering organizational context, risk management strategy, and oversight — provides the cross-sector framework that ties these obligations together.
Common Mistakes Organizations Make with Cyber Risk Metrics
Three reporting failures show up repeatedly at the board level — and each one erodes the credibility that good metrics are supposed to build.
Metric overload. When volume substitutes for clarity, boards cannot identify what requires their attention or a decision. Accountability erodes. Martin recommends limiting board-level metrics to those that can be explained in one sentence without acronyms — if you can't remember them, you have too many.
No business translation. Telling the board the organization blocked 14 million threats gives no basis for a governance decision. Every board-level metric should answer at least one of: What does this mean for financial exposure? For regulatory standing? For operational continuity? Raw counts answer none of these.
Inconsistent methodology. Changing definitions, collection methods, or scope between reporting periods makes trend analysis impossible and erodes board confidence. Defensible reporting requires comparability across periods, not just accuracy within a single one. A metric that moves from yellow to red is only meaningful if the definition of yellow hasn't changed.
Frequently Asked Questions
What are cyber risk metrics?
Cyber risk metrics are structured, repeatable measures of an organization's risk exposure and control effectiveness. They differ from general IT metrics by connecting security data to business impact — financial exposure, operational continuity, and regulatory standing — framed in terms that support leadership decisions.
What is the difference between KRIs and KPIs in cyber risk metrics?
KRIs are forward-looking exposure signals that warn when risk is approaching tolerance thresholds. KPIs are backward-looking performance measures showing how well the security program executed. Boards need both, but rely most heavily on KRIs for governance oversight, since KPIs can only evaluate the team after exposure has already occurred.
What are the key risk indicators (KRIs) used in cyber risk metrics?
Representative KRIs include unpatched critical vulnerability rates, high-severity vulnerability age, privileged account exposure without MFA, and vendor risk score trends. The most useful KRIs are tied to pre-defined thresholds: crossing one triggers escalation rather than a note in a quarterly slide deck.
How often should cyber risk metrics be reported to the board?
Quarterly board-level reporting is the baseline, with defined escalation triggers that bring metrics forward outside the regular cycle when a threshold is crossed or a material incident occurs. The SEC's cybersecurity disclosure rules reinforce the need for clear materiality thresholds that determine when escalation is required.
How do you know if you have too many cyber risk metrics?
The test: does every metric on the board dashboard connect to a specific decision or escalation action? If a metric can be removed without changing any board discussion or governance decision, it belongs at the management level.