
CISO dashboard reporting fixes that. It connects risk posture, program performance, business impact, and accountable next steps in one repeatable view. According to IANS's 2026 benchmark, 95% of CISOs give regular board updates, yet only 25% get 30 minutes or more for discussion. Your dashboard has to earn attention fast.
This guide covers dashboard content, audience-specific views, metric governance, tool selection, and a reporting rhythm that supports faster escalation and fewer surprises.
Key Takeaways
- Report trends, owners, thresholds, and decisions, not an inventory of activity.
- Tie every executive metric to a business outcome, obligation, or action.
- Give boards, executives, operators, and auditors different views of the same data.
- Credibility rests on stable definitions, data freshness, metric owners, and a steady review rhythm.
What Is CISO Dashboard Reporting and Why Does It Matter?
CISO dashboard reporting is the structured presentation of cybersecurity posture, risk movement, control performance, incidents, and remediation progress for decision-makers.
Operational vs. Executive Dashboards
An operational dashboard helps a team act on individual findings: patches, alerts, tickets. An executive dashboard shows material risk, direction of travel, accountability, and the decisions required. Traditional dashboards that highlight patches applied, intrusion attempts blocked, and CVEs detected answer the first need and miss the second.
The Business Value
A well-designed dashboard delivers:
- Clearer board and executive oversight
- More defensible investment decisions
- Faster escalation when something breaks
- Better audit readiness
- Less time assembling reports by hand
NIST IR 8286C ties frequent, transparent risk communication to better enterprise decisions. That is governance guidance, not a proven dashboard ROI figure, so treat it as support for the approach rather than a guarantee.
Start With the Question
Every metric should answer something leadership needs to know:
- Is exposure decreasing?
- Do critical risks have owners?
- Are controls operating effectively?
- Where do we need more resources?
If a metric answers none of these, it belongs in operational reporting.
What Should a CISO Dashboard Report?
Executive Posture Summary
Open with a compact summary covering:
- Overall risk direction
- Material changes since the last period
- Highest-priority unresolved issues
- Decisions or escalations required
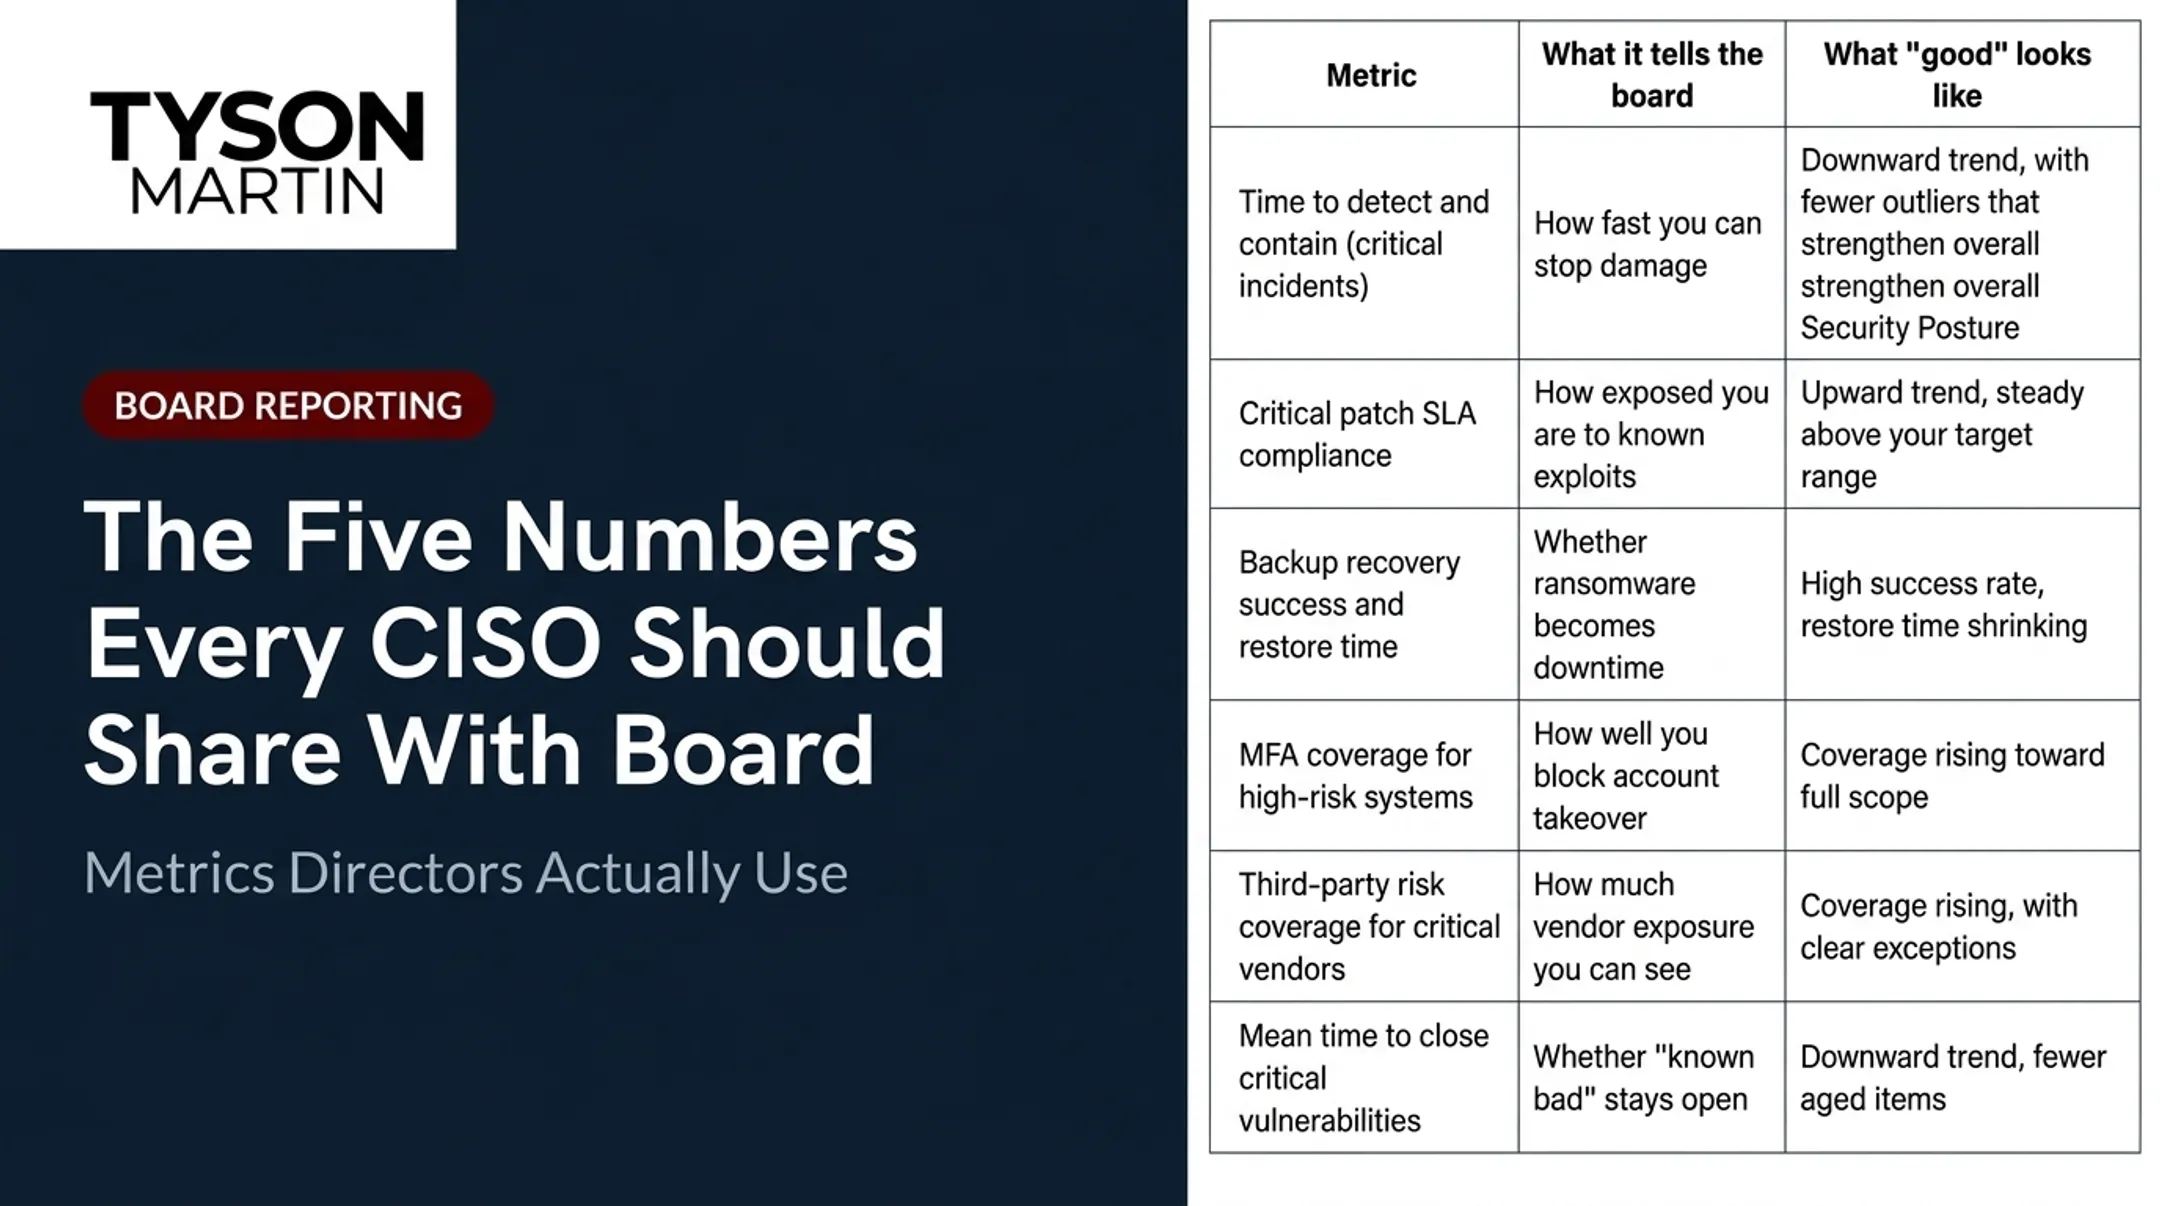
A ranked "top five material risk scenarios" view works well, showing movement over time and the next decision.
Vulnerability and Exposure
Raw counts mislead. Report:
- Asset criticality and exploit context
- Remediation age and SLA performance
- Exceptions and owners
A useful example is critical vulnerability burn-down by tier, showing count and age on Tier 1 versus Tier 2 assets.
Exposure signals measure different things, so don't blend them into one score:
- CISA KEV: confirmed active exploitation
- EPSS: probability of exploitation within 30 days
- CVSS: technical severity only; FIRST states it is not risk
- CISA SSVC: response categories such as Track or Act
Verizon's 2026 DBIR puts median full remediation of critical and KEV vulnerabilities at 43 days, a useful reference point, not your target.
Incidents and Resilience
Include:
- Severity and volume trends
- Detection and containment performance
- Recurring causes, recovery readiness, and lessons learned
For high-severity Tier 1 events, falling time to detect and contain with fewer outliers is a good trend.
Mandiant's M-Trends 2026 reports a global median dwell time of 14 days. IBM's 2025 report cites a 241-day mean to identify and contain. They use different definitions, so keep them separate.

Identity, Cloud, and Third-Party Risk
Tailor this to your environment:
- Privileged access exposure and MFA coverage gaps (phishing-resistant MFA, not just any MFA)
- Cloud misconfiguration ownership
- Percent of critical vendors with current risk reviews and tested incident communication
- A plan for any top-10 vendor being down 72 hours
Verizon found 37% of organizations had an IaaS administrator account with MFA disabled, and third parties were involved in 30% of breaches in the 2025 report.
Compliance and Control Effectiveness
Separate "compliant" from "operating consistently." Map reporting to your applicable frameworks and contractual or regulatory duties, such as controls tested per quarter under NIST CSF or ISO 27001. Include time to respond to regulator or customer inquiries.
Program Execution and Investment
Show:
- Progress against priorities and overdue initiatives
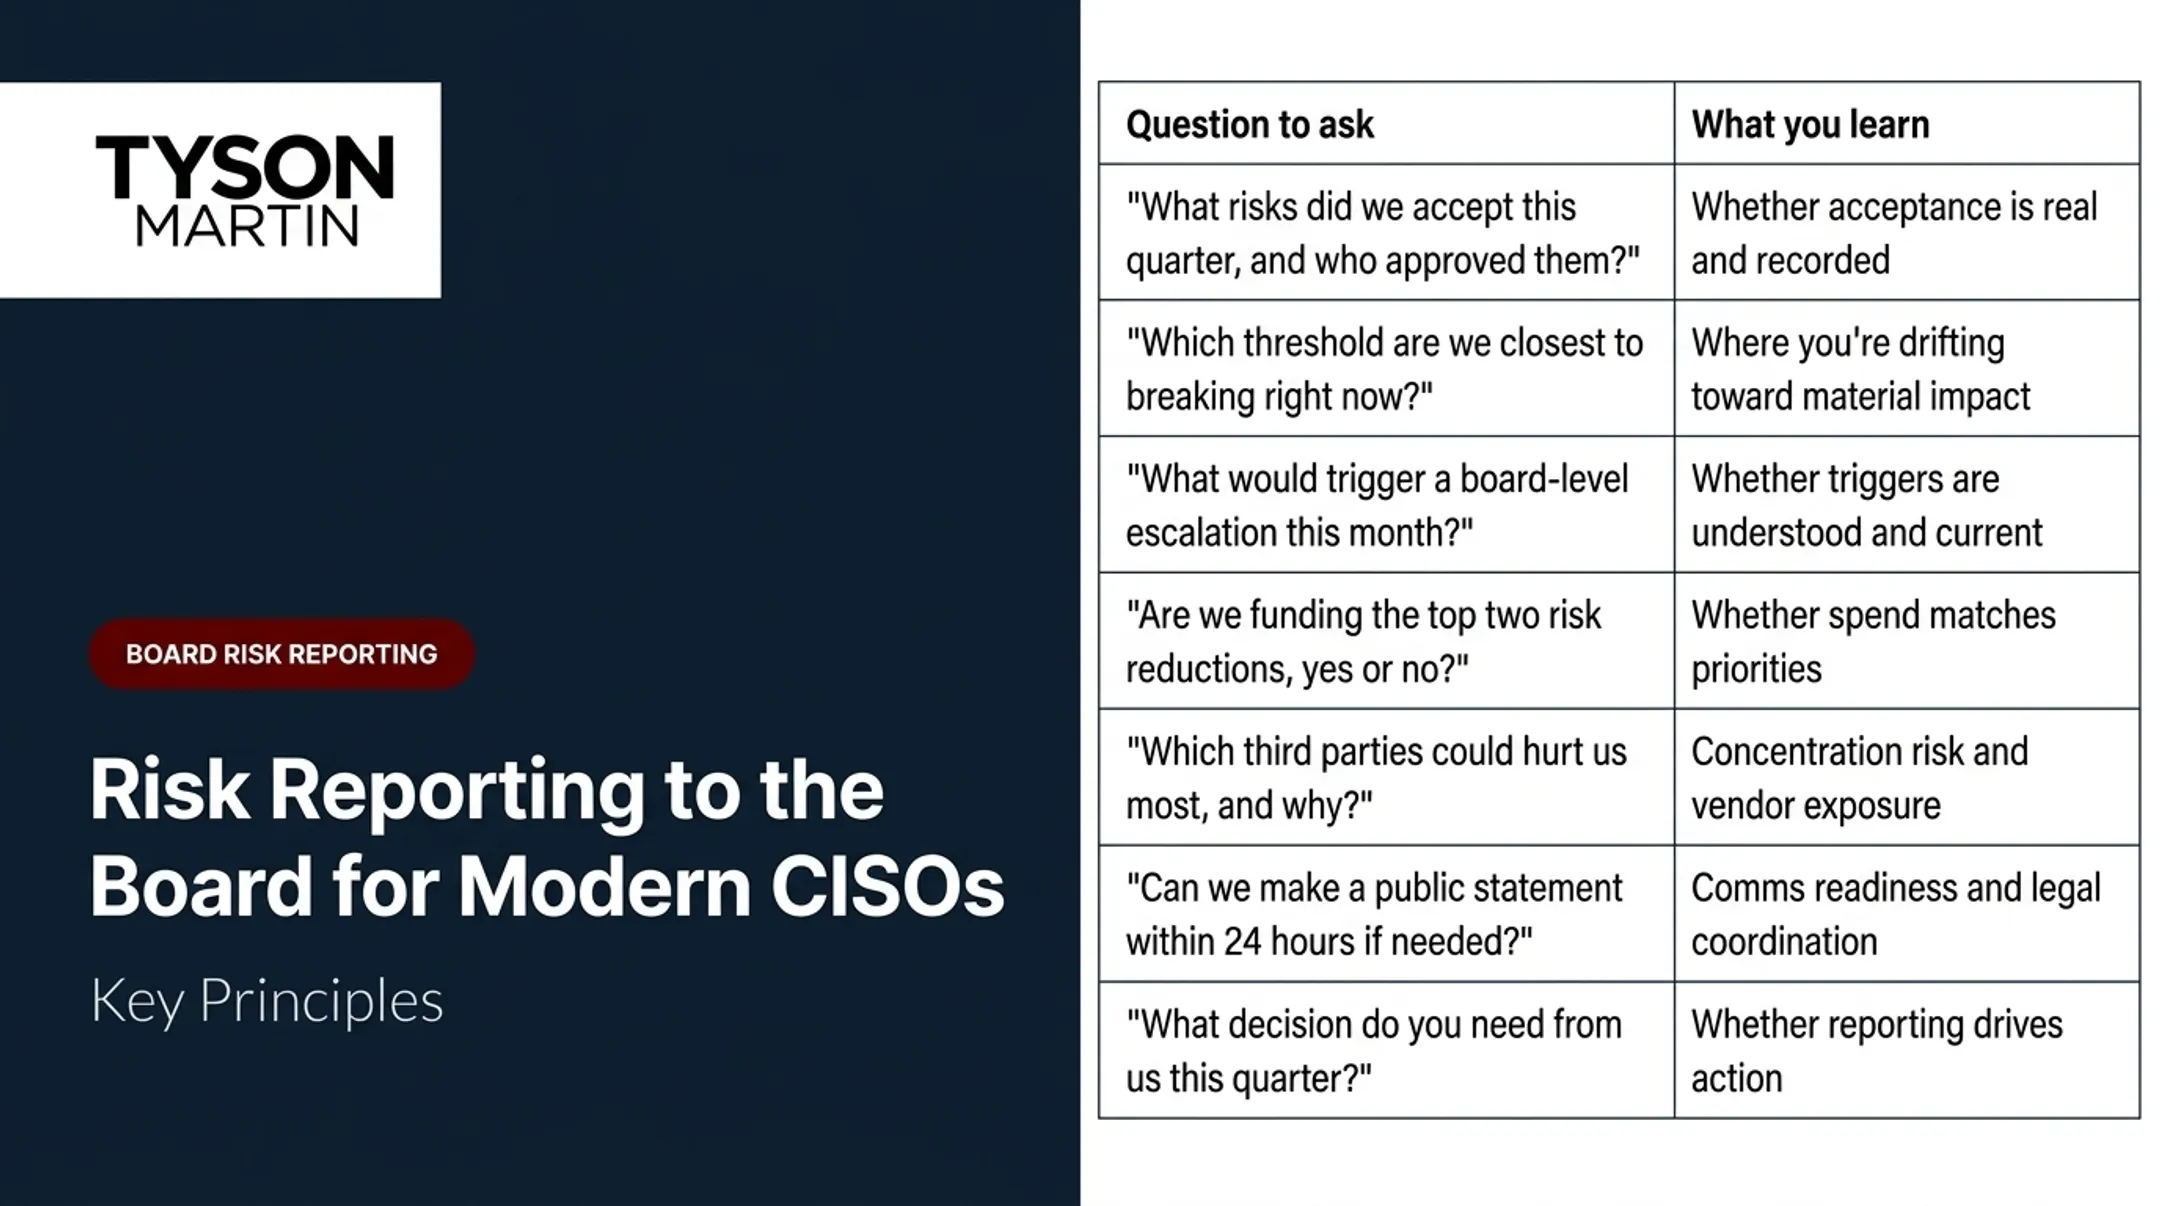
- Staffing gaps and risk acceptance decisions
- Evidence that funded work reduces exposure
Critical risk acceptance cycle time shows how long exceptions wait for a decision.
How to Build a Board-Ready CISO Reporting Dashboard
Define Audience and Decisions First
Before picking metrics, settle who reviews it, which meeting it supports, how often, and what decisions it must enable.
Build Audience-Specific Views
- Board and audit committee: plain-English risk statements, trends, material issues, business impact, and decisions required
- Risk committee: scenarios and appetite alongside evidence the board can act on
- Audit committee focus: evidence and assurance over narrative color
- Executive and management: add owners, resource needs, deadlines, and cross-functional dependencies.
- Operational: drill-down detail for remediation, incidents, and control testing, kept off the board view.
Board reporting should fit on one page. If management needs 40 slides, the story isn't crisp.
Govern Every Metric
NIST SP 800-55 supplies fields such as goal, scope, formula, target, and time reference. For each metric, document:
- Definition and calculation method
- Data owner and source system
- Reporting period and freshness timestamp
- Baseline, target, and threshold
- Escalation rule
Track 5 to 10 enterprise cyber risks and roll the rest into operations. If you change a definition, disclose it; an expanded scope resets the baseline.
Write the Narrative
Structure it around what changed, why, why it matters, and what happens next. Every red or amber status needs:
- An owner and due date
- Mitigation in progress
- A clear escalation path
For each top risk, require a named business owner, target state, real milestone date, and budget tied to the outcome.

Choose a Platform
Evaluate integration, data protection, access controls, auditability, refresh needs, scalability, usability, and support capacity. None of these wins on every criterion:
| Option | Strength | Watch for |
|---|---|---|
| Excel | Quick, familiar; supports database connections | Show Changes excludes charts and formatting |
| Power BI | Cloud and on-premises sources, scheduled refresh | Row-level security doesn't restrict workspace Admins, Members, or Contributors |
| Tableau Cloud | Extract schedules, permission rules | Activity log retention depends on license edition |
| ServiceNow Risk | Consolidates GRC workspaces, role-based | Audits only records flagged for auditing |
| Hyperproof | Evidence automation, activity feeds | Fits control evidence more than general BI |
Don't buy tools to compensate for missing decision rights. Fix who decides what first.
Pilot It
Test with a few executives or directors. Can they state the main message without technical translation? Publish a first draft by day 30, even unfinished.
Reporting quality changes outcomes. In 2023, the SEC fined Blackbaud $3 million after disclosure-control failures kept the true scope of a 2020 ransomware attack from senior management. It shows an escalation failure, not proof a dashboard would have prevented it.
How to Turn the Dashboard Into a Reporting Rhythm
Set Cadence by Use Case
- Operational: daily or weekly, as data demands
- Management: weekly or monthly reviews of remediation and execution
- Board and audit committee: at least quarterly per NACD, with immediate reporting of material incidents
Keep routine oversight separate from disclosure. The SEC's Item 1.05 generally requires filing within four business days after a materiality determination, not after discovery.
Run a Repeatable Meeting
- Review the posture summary and current risk status
- Explain significant changes since the last period
- Inspect overdue or escalating risks that need attention
- Confirm decisions and owners for open items
- Record actions for the next reporting period

Keep the Source of Truth Stable
Let narrative and priorities evolve while definitions stay put:
- Retire metrics that don't influence decisions
- Log definition changes
- Preserve history for comparison
Tyson Martin's board advisory and fractional CISO work helps organizations establish credible reporting and clarify decision rights. That includes setting escalation thresholds and turning dashboard findings into a 90-day plan with owners and measurable outcomes.
Common CISO Dashboard Reporting Mistakes
- Vanity metrics: scans run, alerts blocked, policies counted, or audit findings closed say little about risk. NIST warns that poorly chosen metrics undermine confidence.
- Unexplained status: NIST treats colored matrices as qualitative and subjective. Show context, timestamp, owner, threshold, and trend; point-in-time snapshots without trend lines hide direction.
- Stale or inconsistent data: mixed definitions and old numbers destroy trust quickly.
- Passive reporting: every material issue lacks a treatment decision, owner, deadline, escalation condition, and follow-up. When a metric goes red, clarify business impact, approve tradeoffs, and confirm owners and dates.
Frequently Asked Questions
What are the top 5 dashboard tools?
No universal ranking exists. Excel, Power BI, Tableau Cloud, ServiceNow Risk, and Hyperproof are common options; choose based on integrations, audience, access requirements, cadence, budget, and in-house skills.
What should be included in a CISO dashboard?
Executive posture, material risks, incidents, vulnerability exposure, control effectiveness, third-party or cloud risk where relevant, program progress, trends, owners, and decisions required.
How often should a CISO dashboard be updated?
Separate data refresh from reporting. Refresh operational data as needed; align board reporting to governance meetings, at least quarterly, plus material risk changes.
How is a CISO dashboard different from a board cybersecurity report?
The dashboard is the maintained source of data and trends. The board report is a curated narrative on material risk, oversight, business impact, and decisions.
How do you choose the right CISO dashboard metrics?
Start with stakeholder decisions and business outcomes. Then pick metrics with reliable sources, clear owners, defined thresholds, and a demonstrated link to risk treatment.